
Feature of canva infographic template:
Sale!
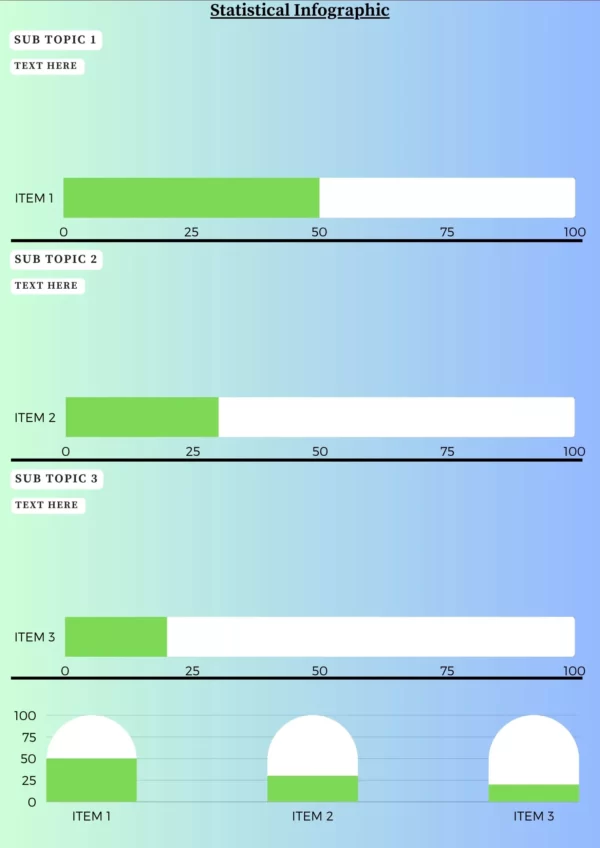
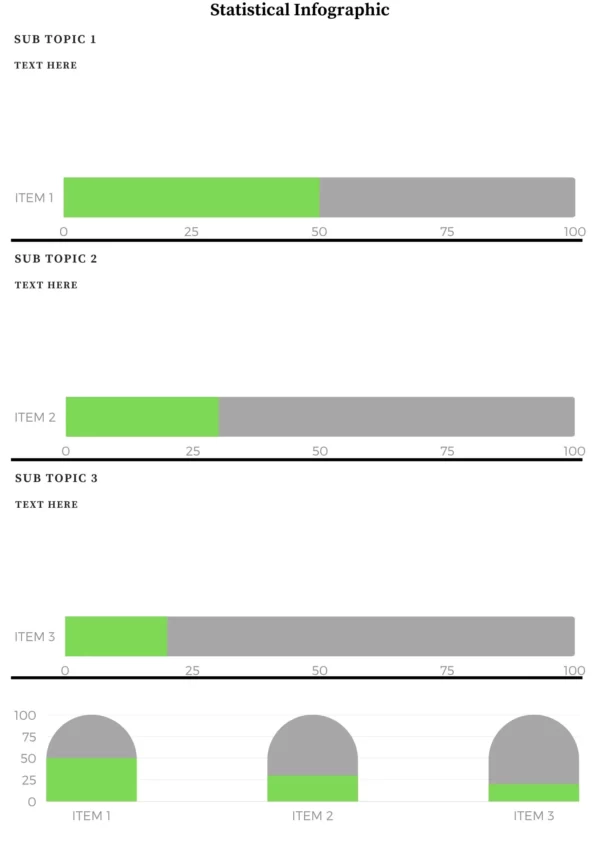
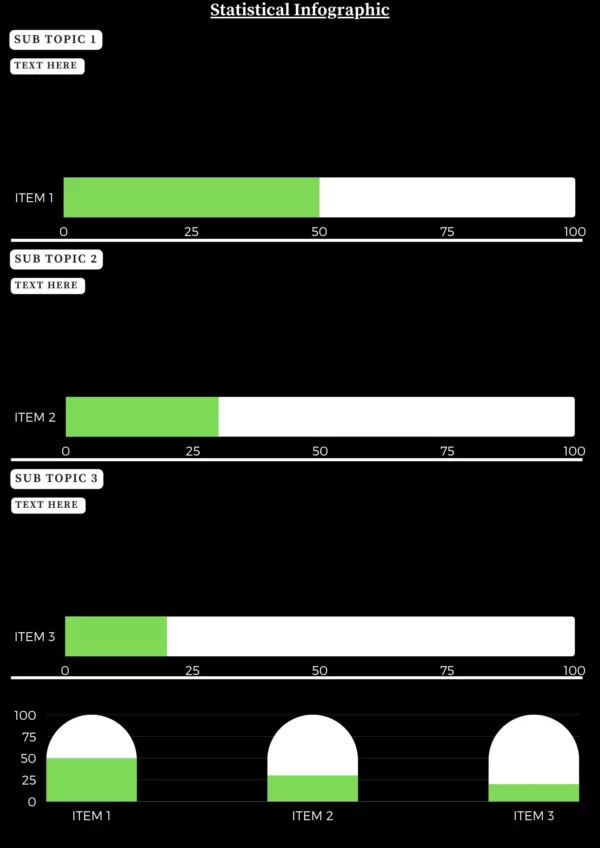
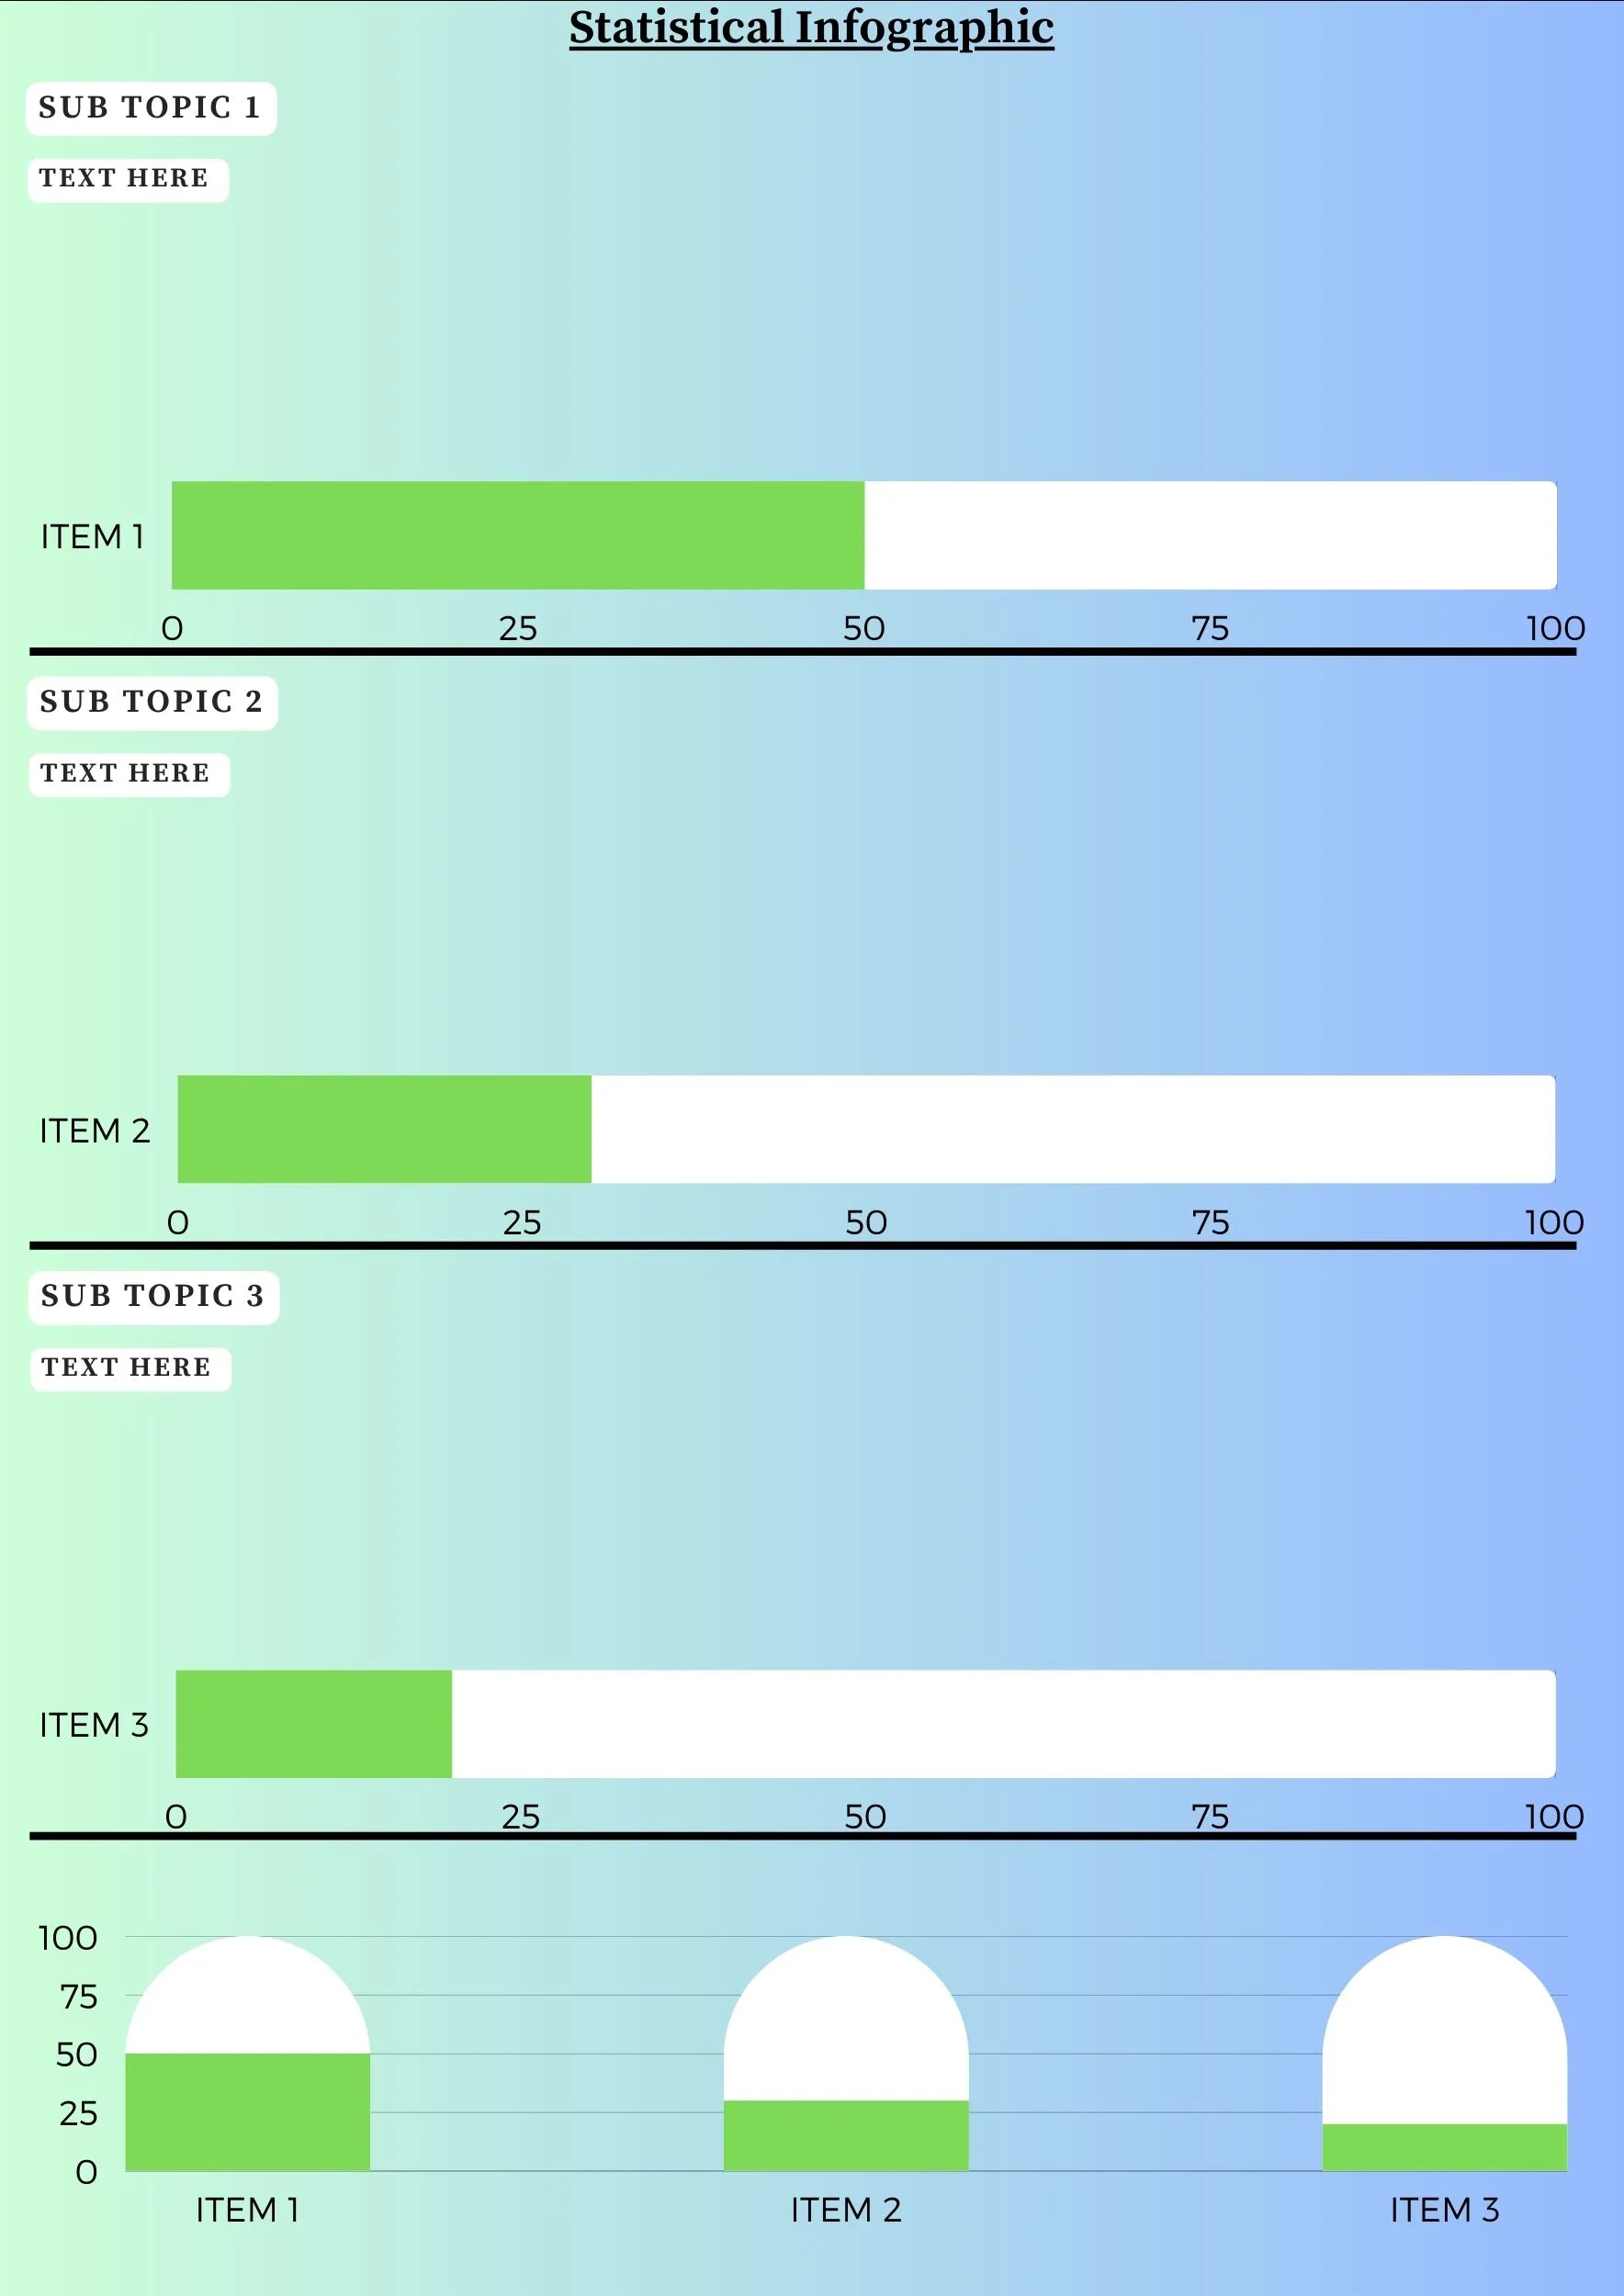


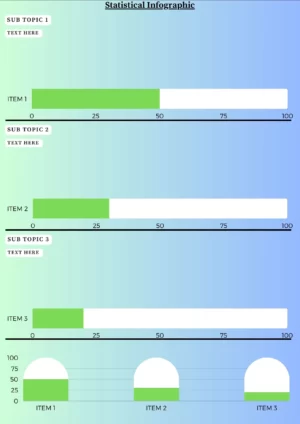
Statistical Infographic template
Original price was: $9.99.$5.99Current price is: $5.99.
Statistical Infographic template is used to present statistical data in an easy-to-understand, visually appealing format. It typically consists of a few key elements, including a header, the main content, and a footer. The header provides the context for the data, such as the source and the date. The main content is the visual representation of the data, such as a chart or graph. The footer provides further context, such as notes on the data or supplemental information. This template can be used to present data in a straightforward way, allowing readers to quickly understand the information and draw their own conclusions.
1 review for Statistical Infographic template
You must be logged in to post a review.
Related products
-
Sale!
 Infographic
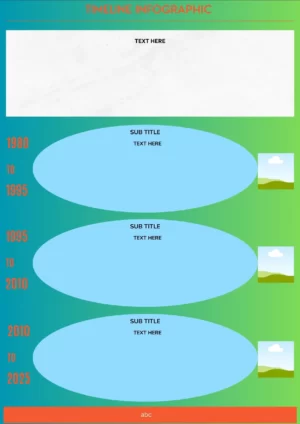
Timeline infographic template
Original price was: $9.99.$5.99Current price is: $5.99. Add to basketTimeline infographic template is a great way to convey complex information in an easy to understand visual format. This type of template allows you to easily create a timeline that can be used to showcase the history of a particular event, project, or business. Timeline infographic template can also be used to track progress over time or to compare different projects or events.
Once your timeline is complete, you can customize the template to fit the style and design that best suits your needs. You can add colors, fonts, and other design elements to make it more visually appealing. You can also add interactive elements, such as buttons and drop-down menus, to make your timeline more engaging.
When finished, you can save your timeline infographic template and use it to share information with others. This type of template can be used in a variety of contexts, from business presentations to blog posts. It is a great way to make complicated information easier to understand and to provide a visual representation of past events, current projects, or future goals.
-
Sale!
 Infographic
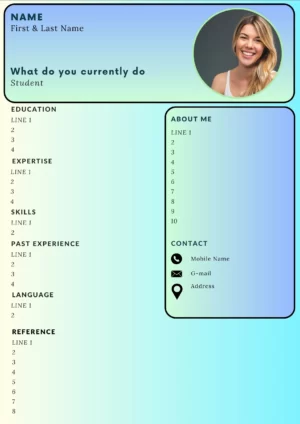
Resume Infographic template
Original price was: $9.99.$5.99Current price is: $5.99. Add to basketResume Infographic template is designed to make your resume stand out from the rest. It is easy to customize and is a great way to showcase your skills, work experience, and education in a visually appealing way. The template includes sections for your contact information, a summary of your qualifications, work history, education, and a list of your skills and competencies. Additionally, resume Infographic template features several icons and shapes to emphasize the most important details of your resume.
This template is perfect for job seekers looking for a modern way to present their resume information.
luxmibhaskarb@gmail.com –
y