The following are all the types of infographic templates that you can choose from
Here is a brief overview of all the types of infographic templates and how they can be used for your task
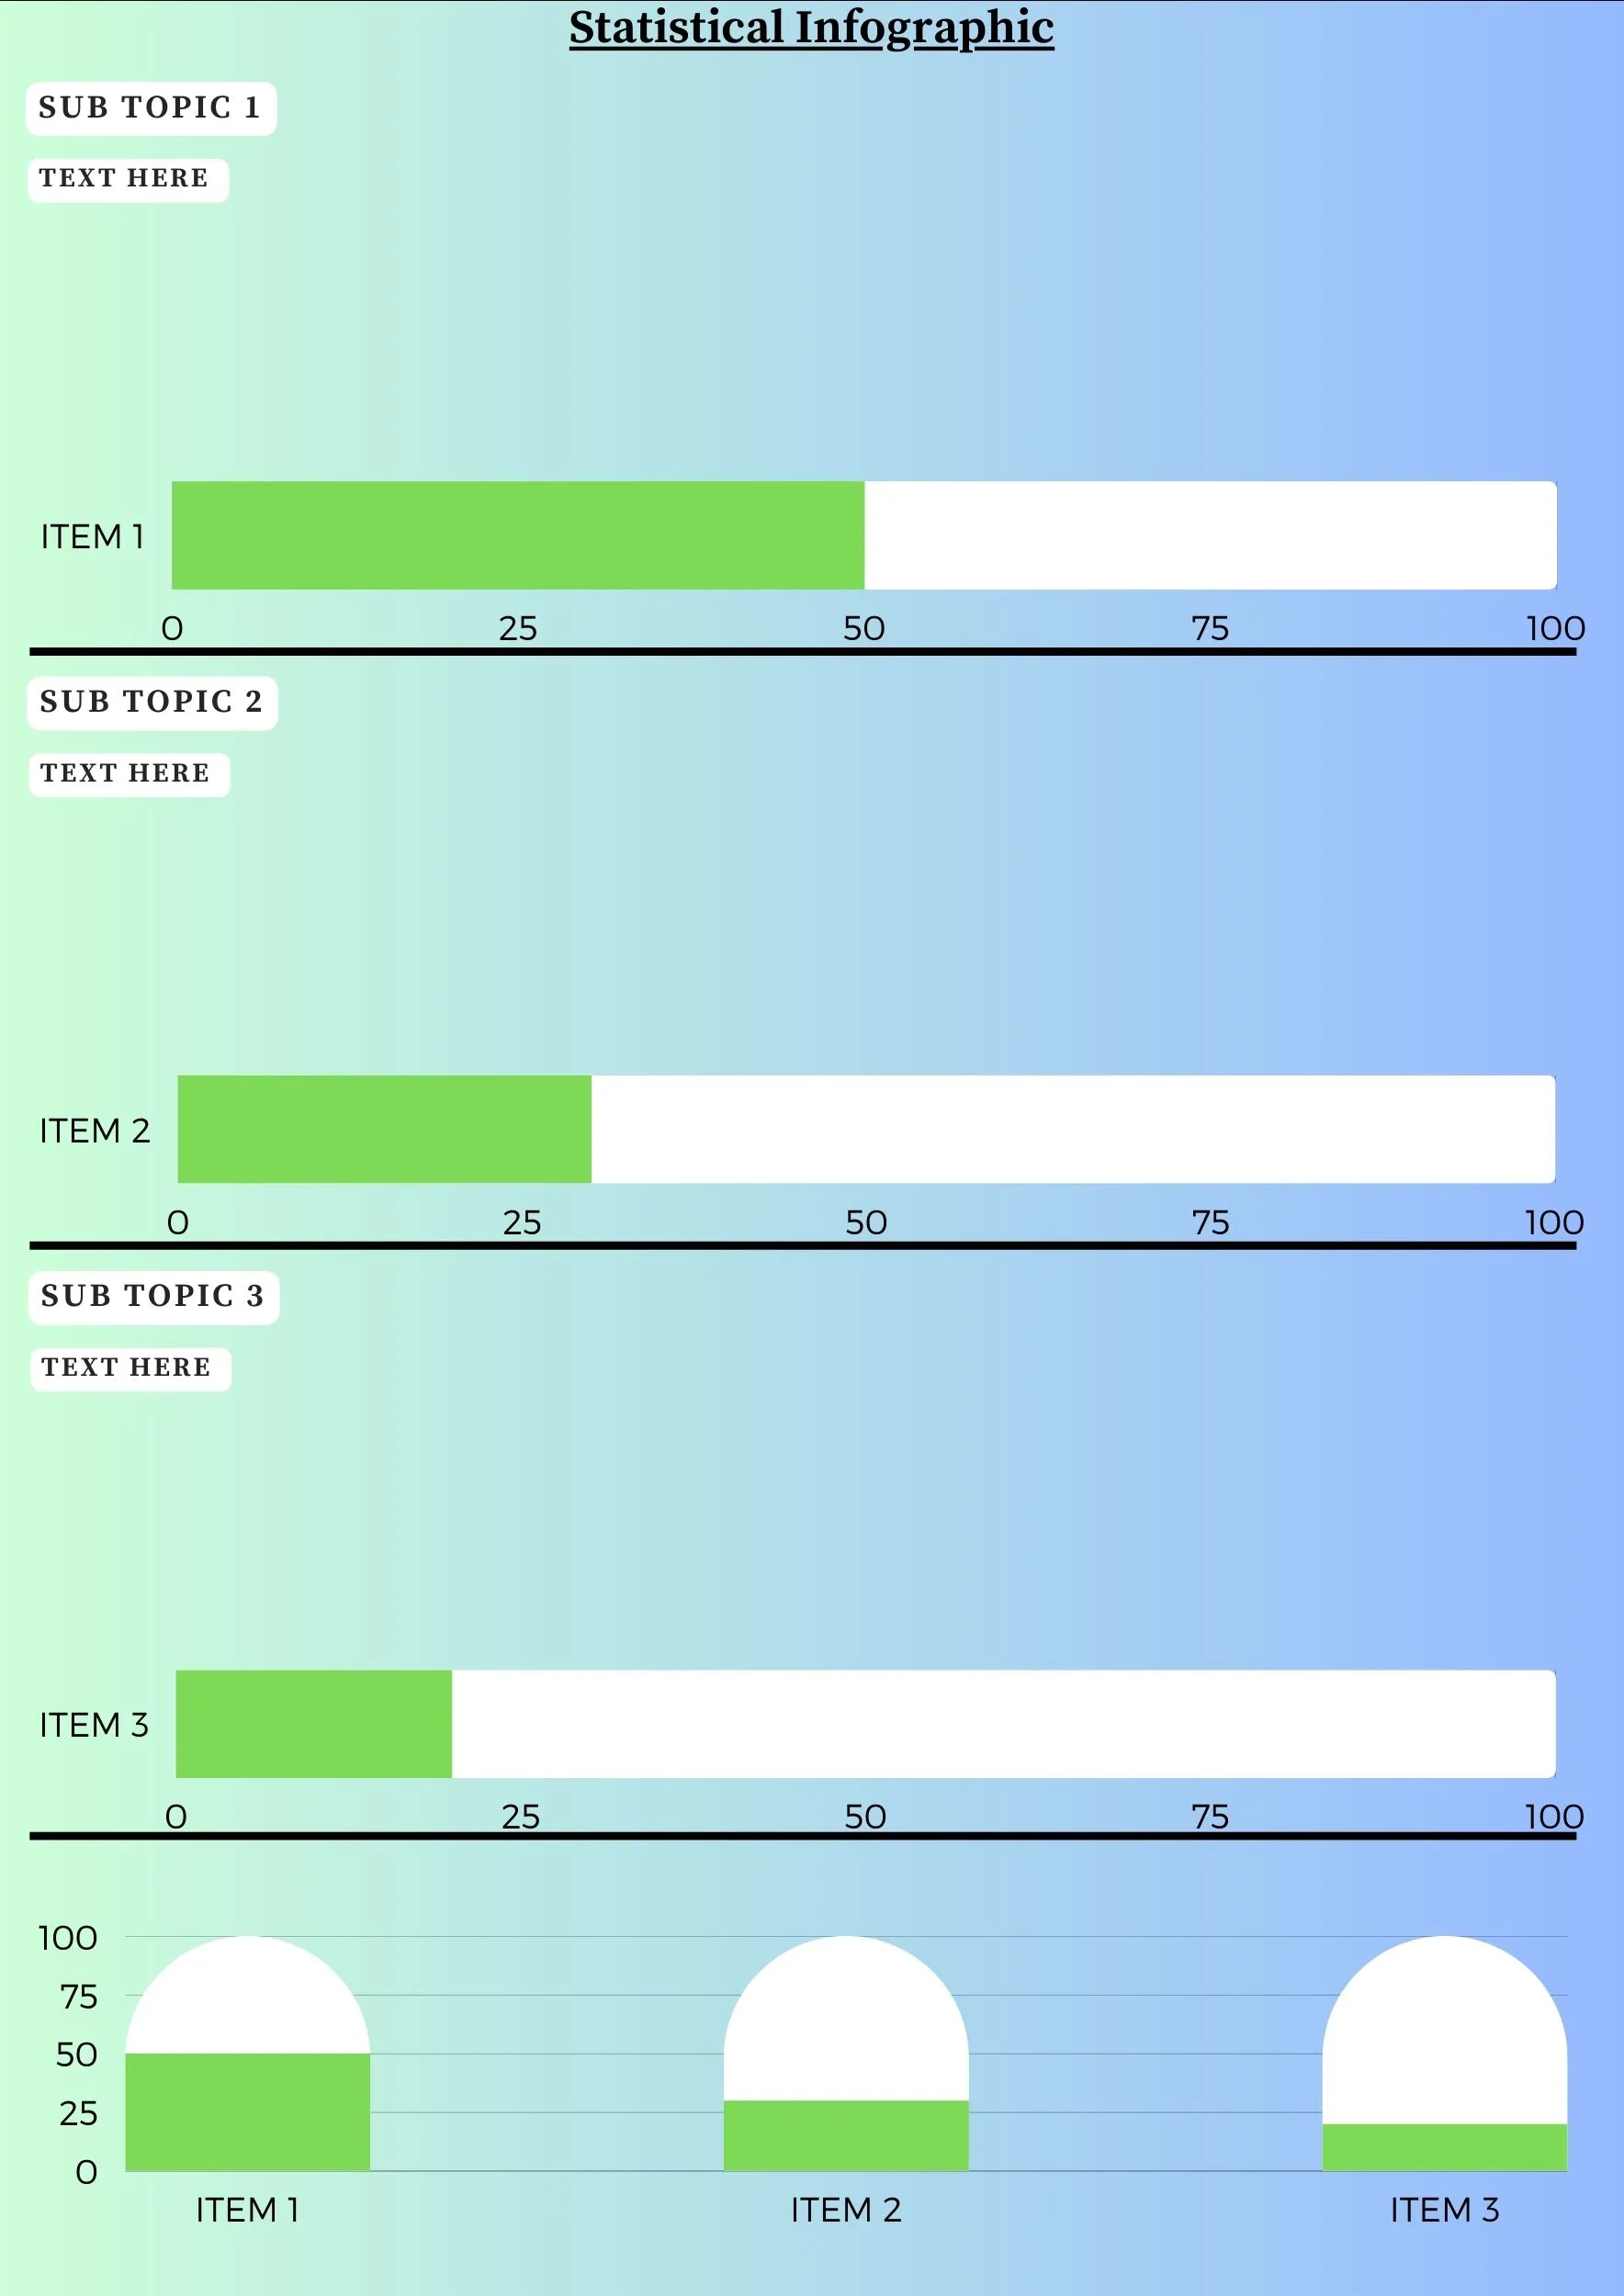
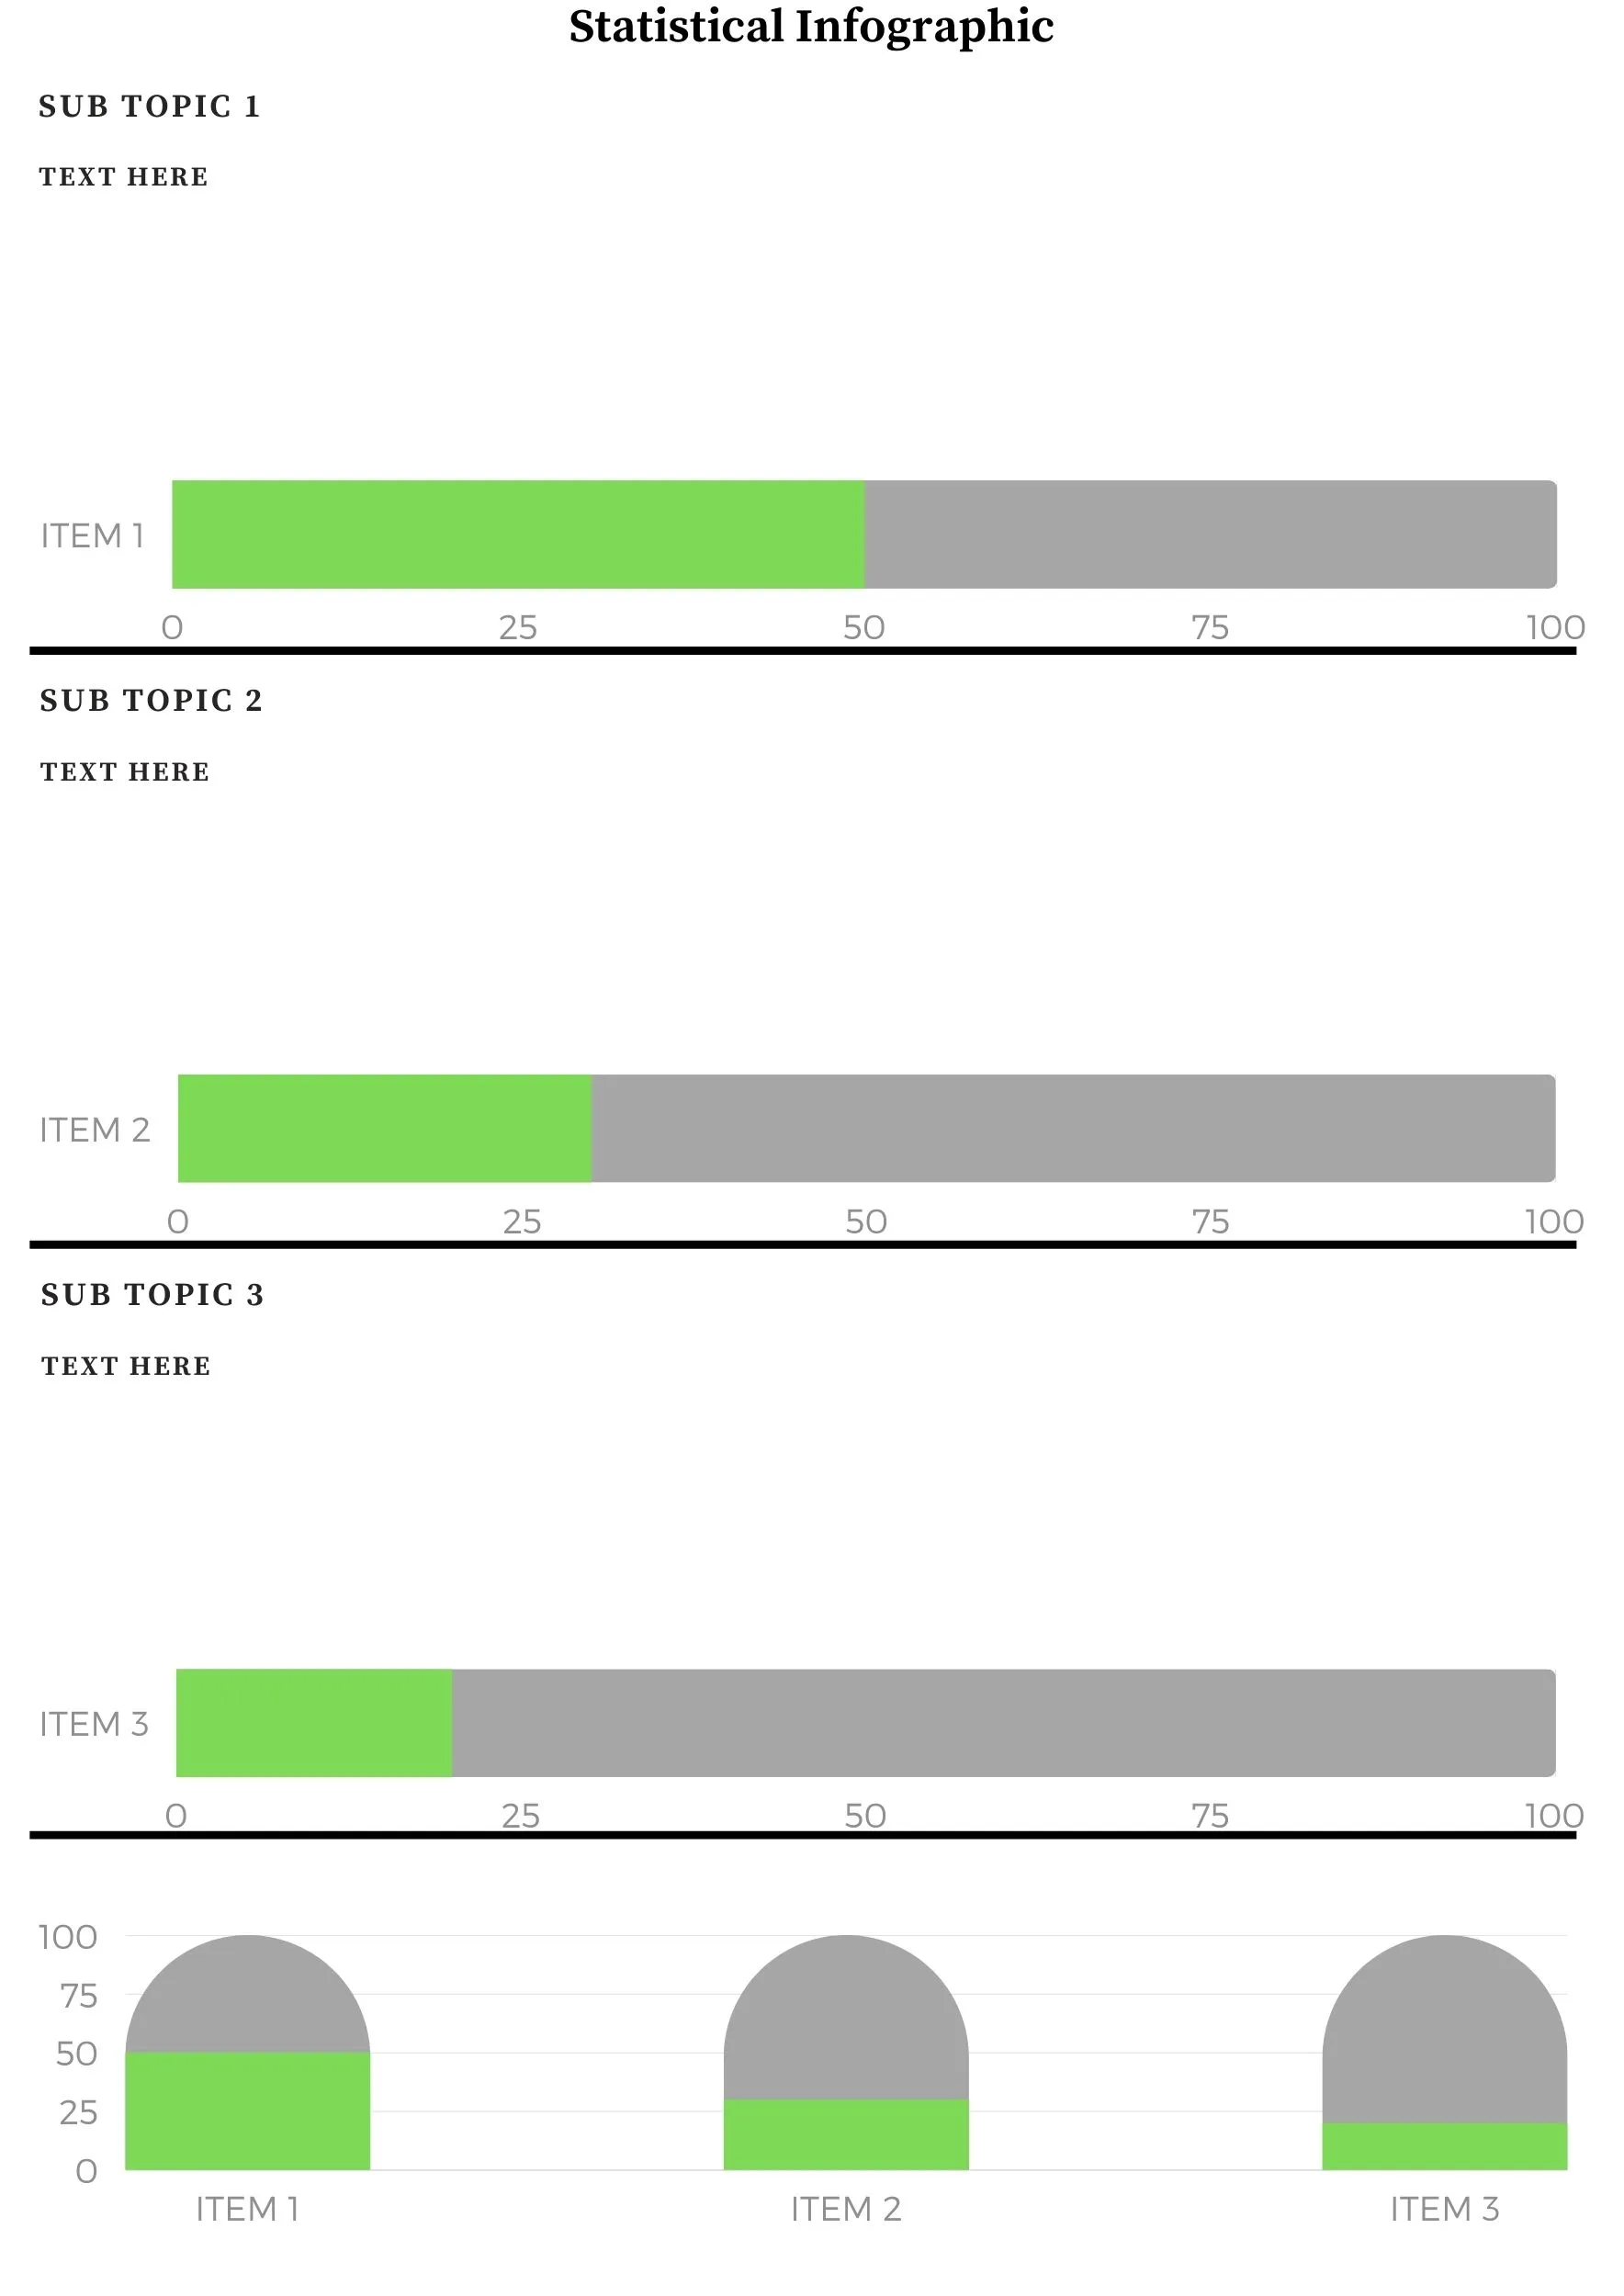
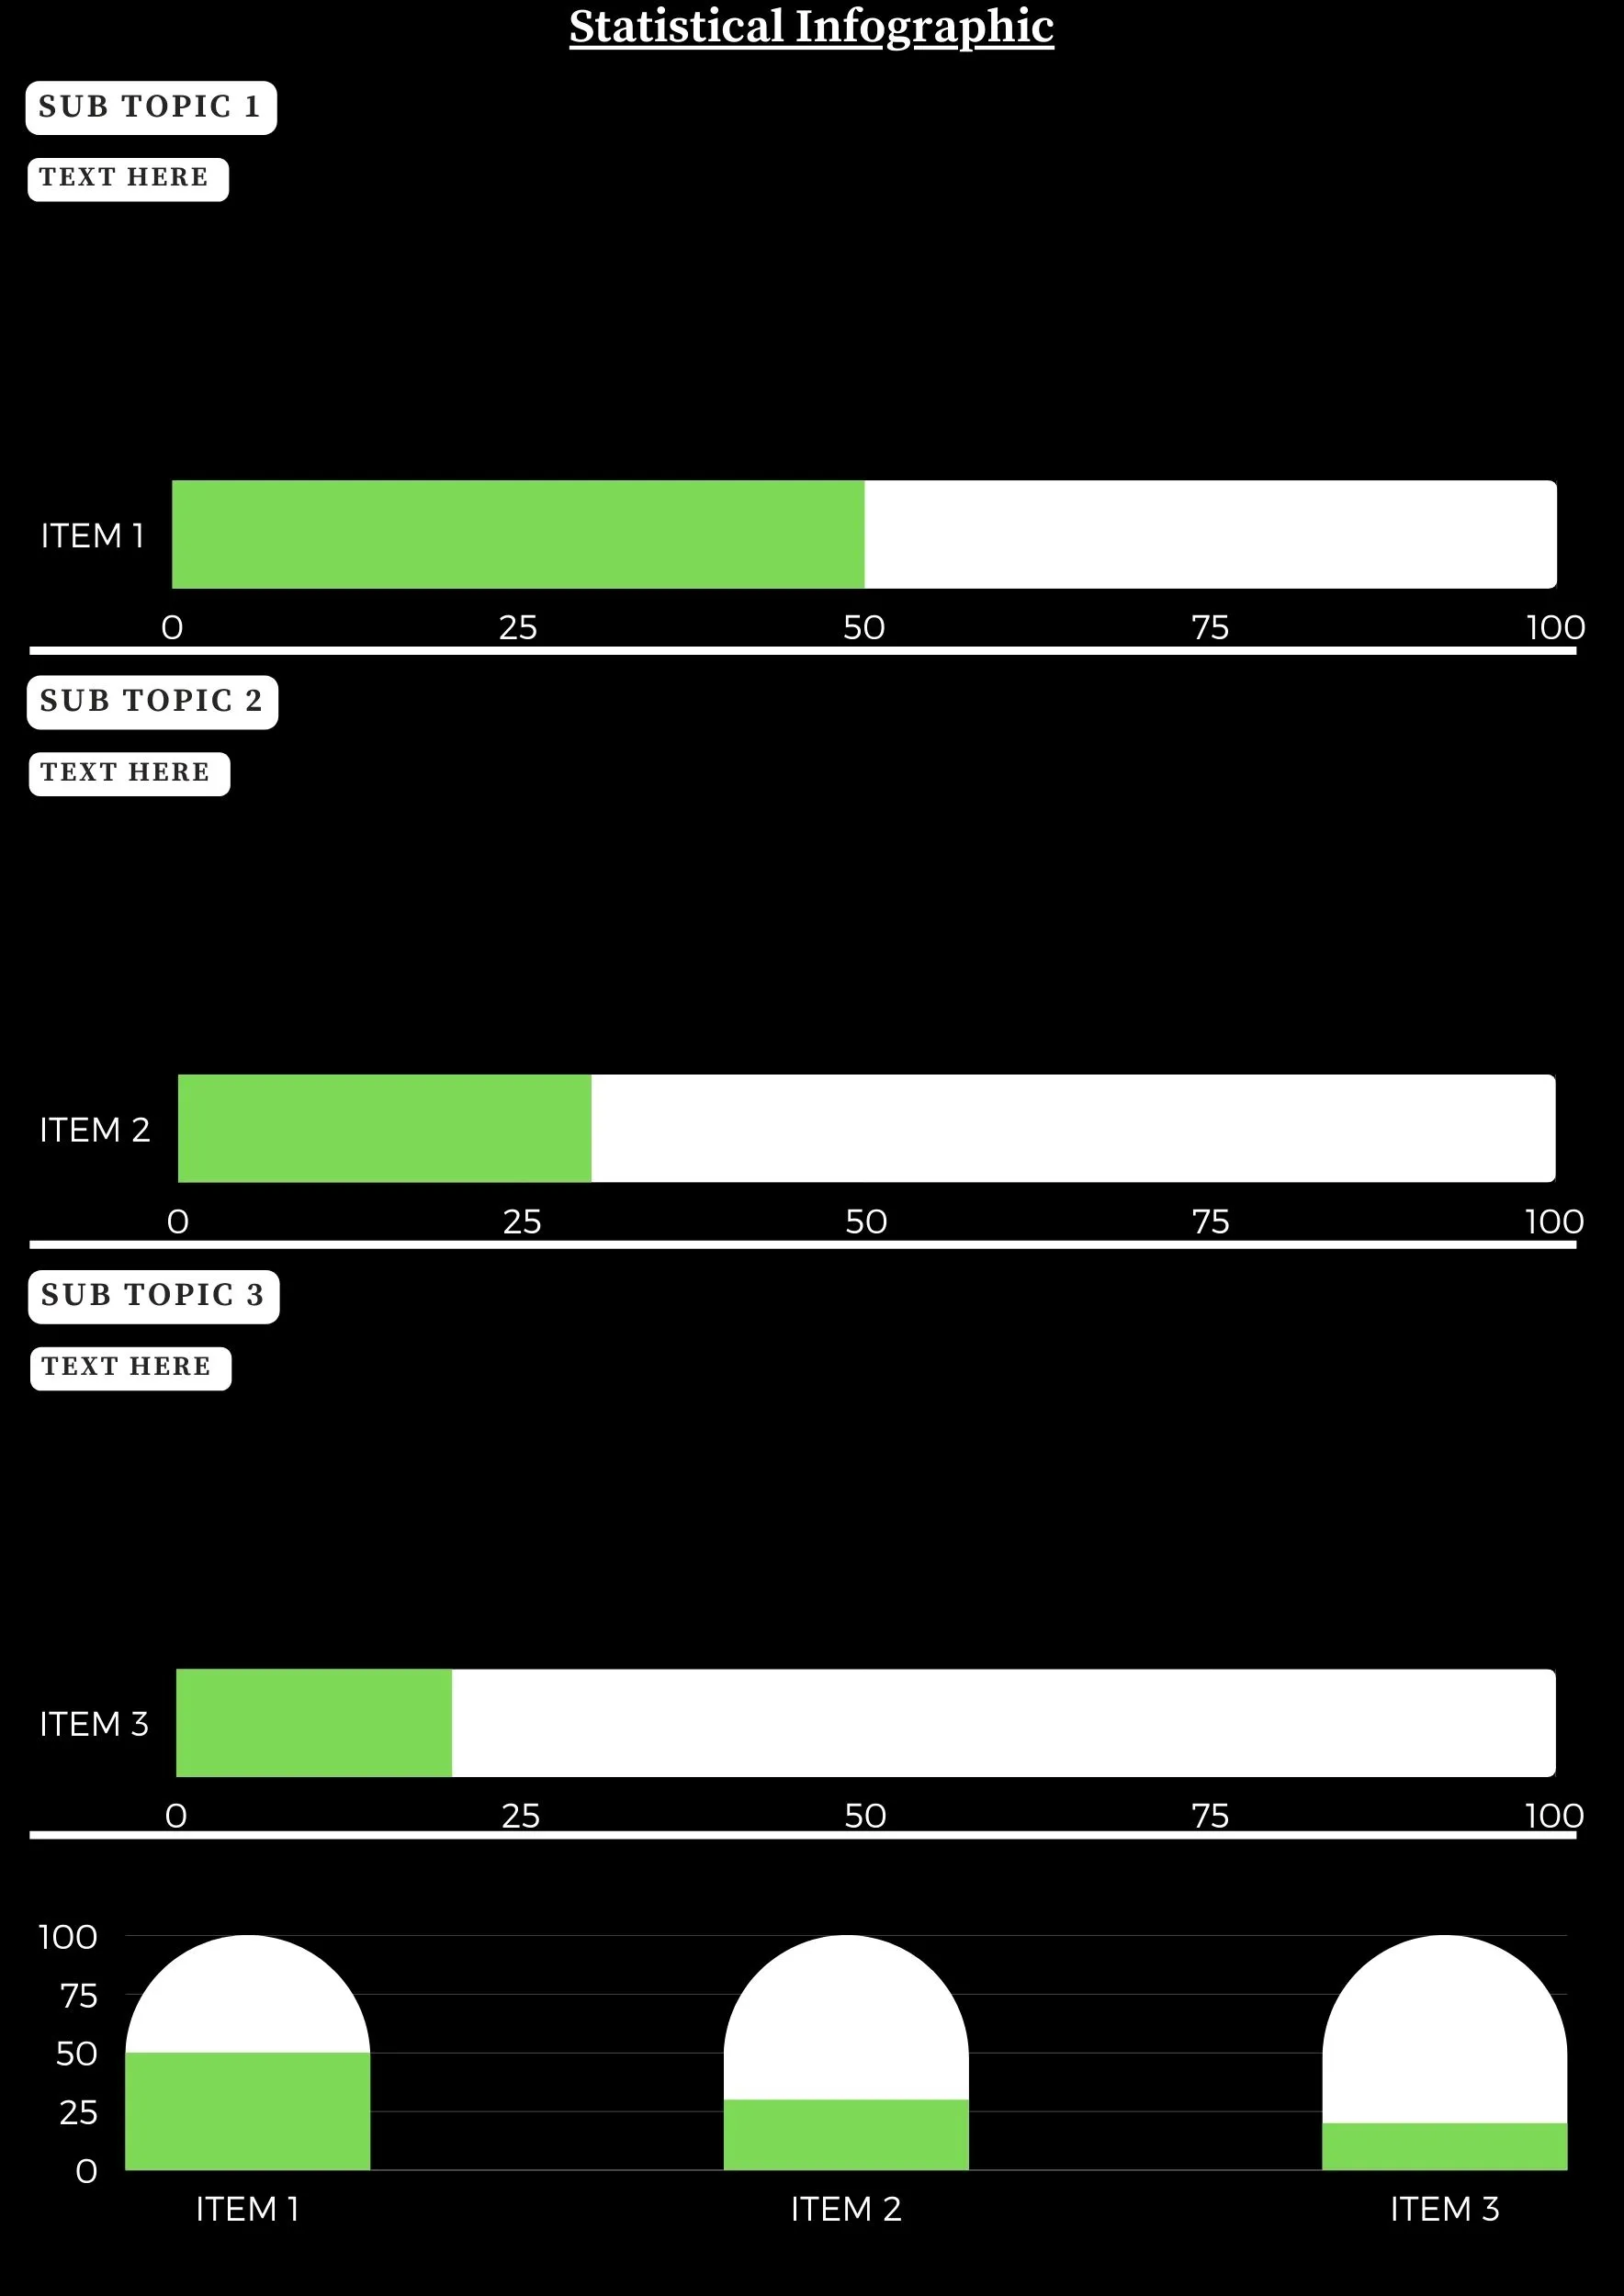
Statistical / Mixed chart
A statistical infographic is a visual representation of data that uses charts, graphs, and other visuals to tell a story. They are often used to communicate complex information in a way that is easy to understand. Statistical infographics can be used for a variety of purposes.
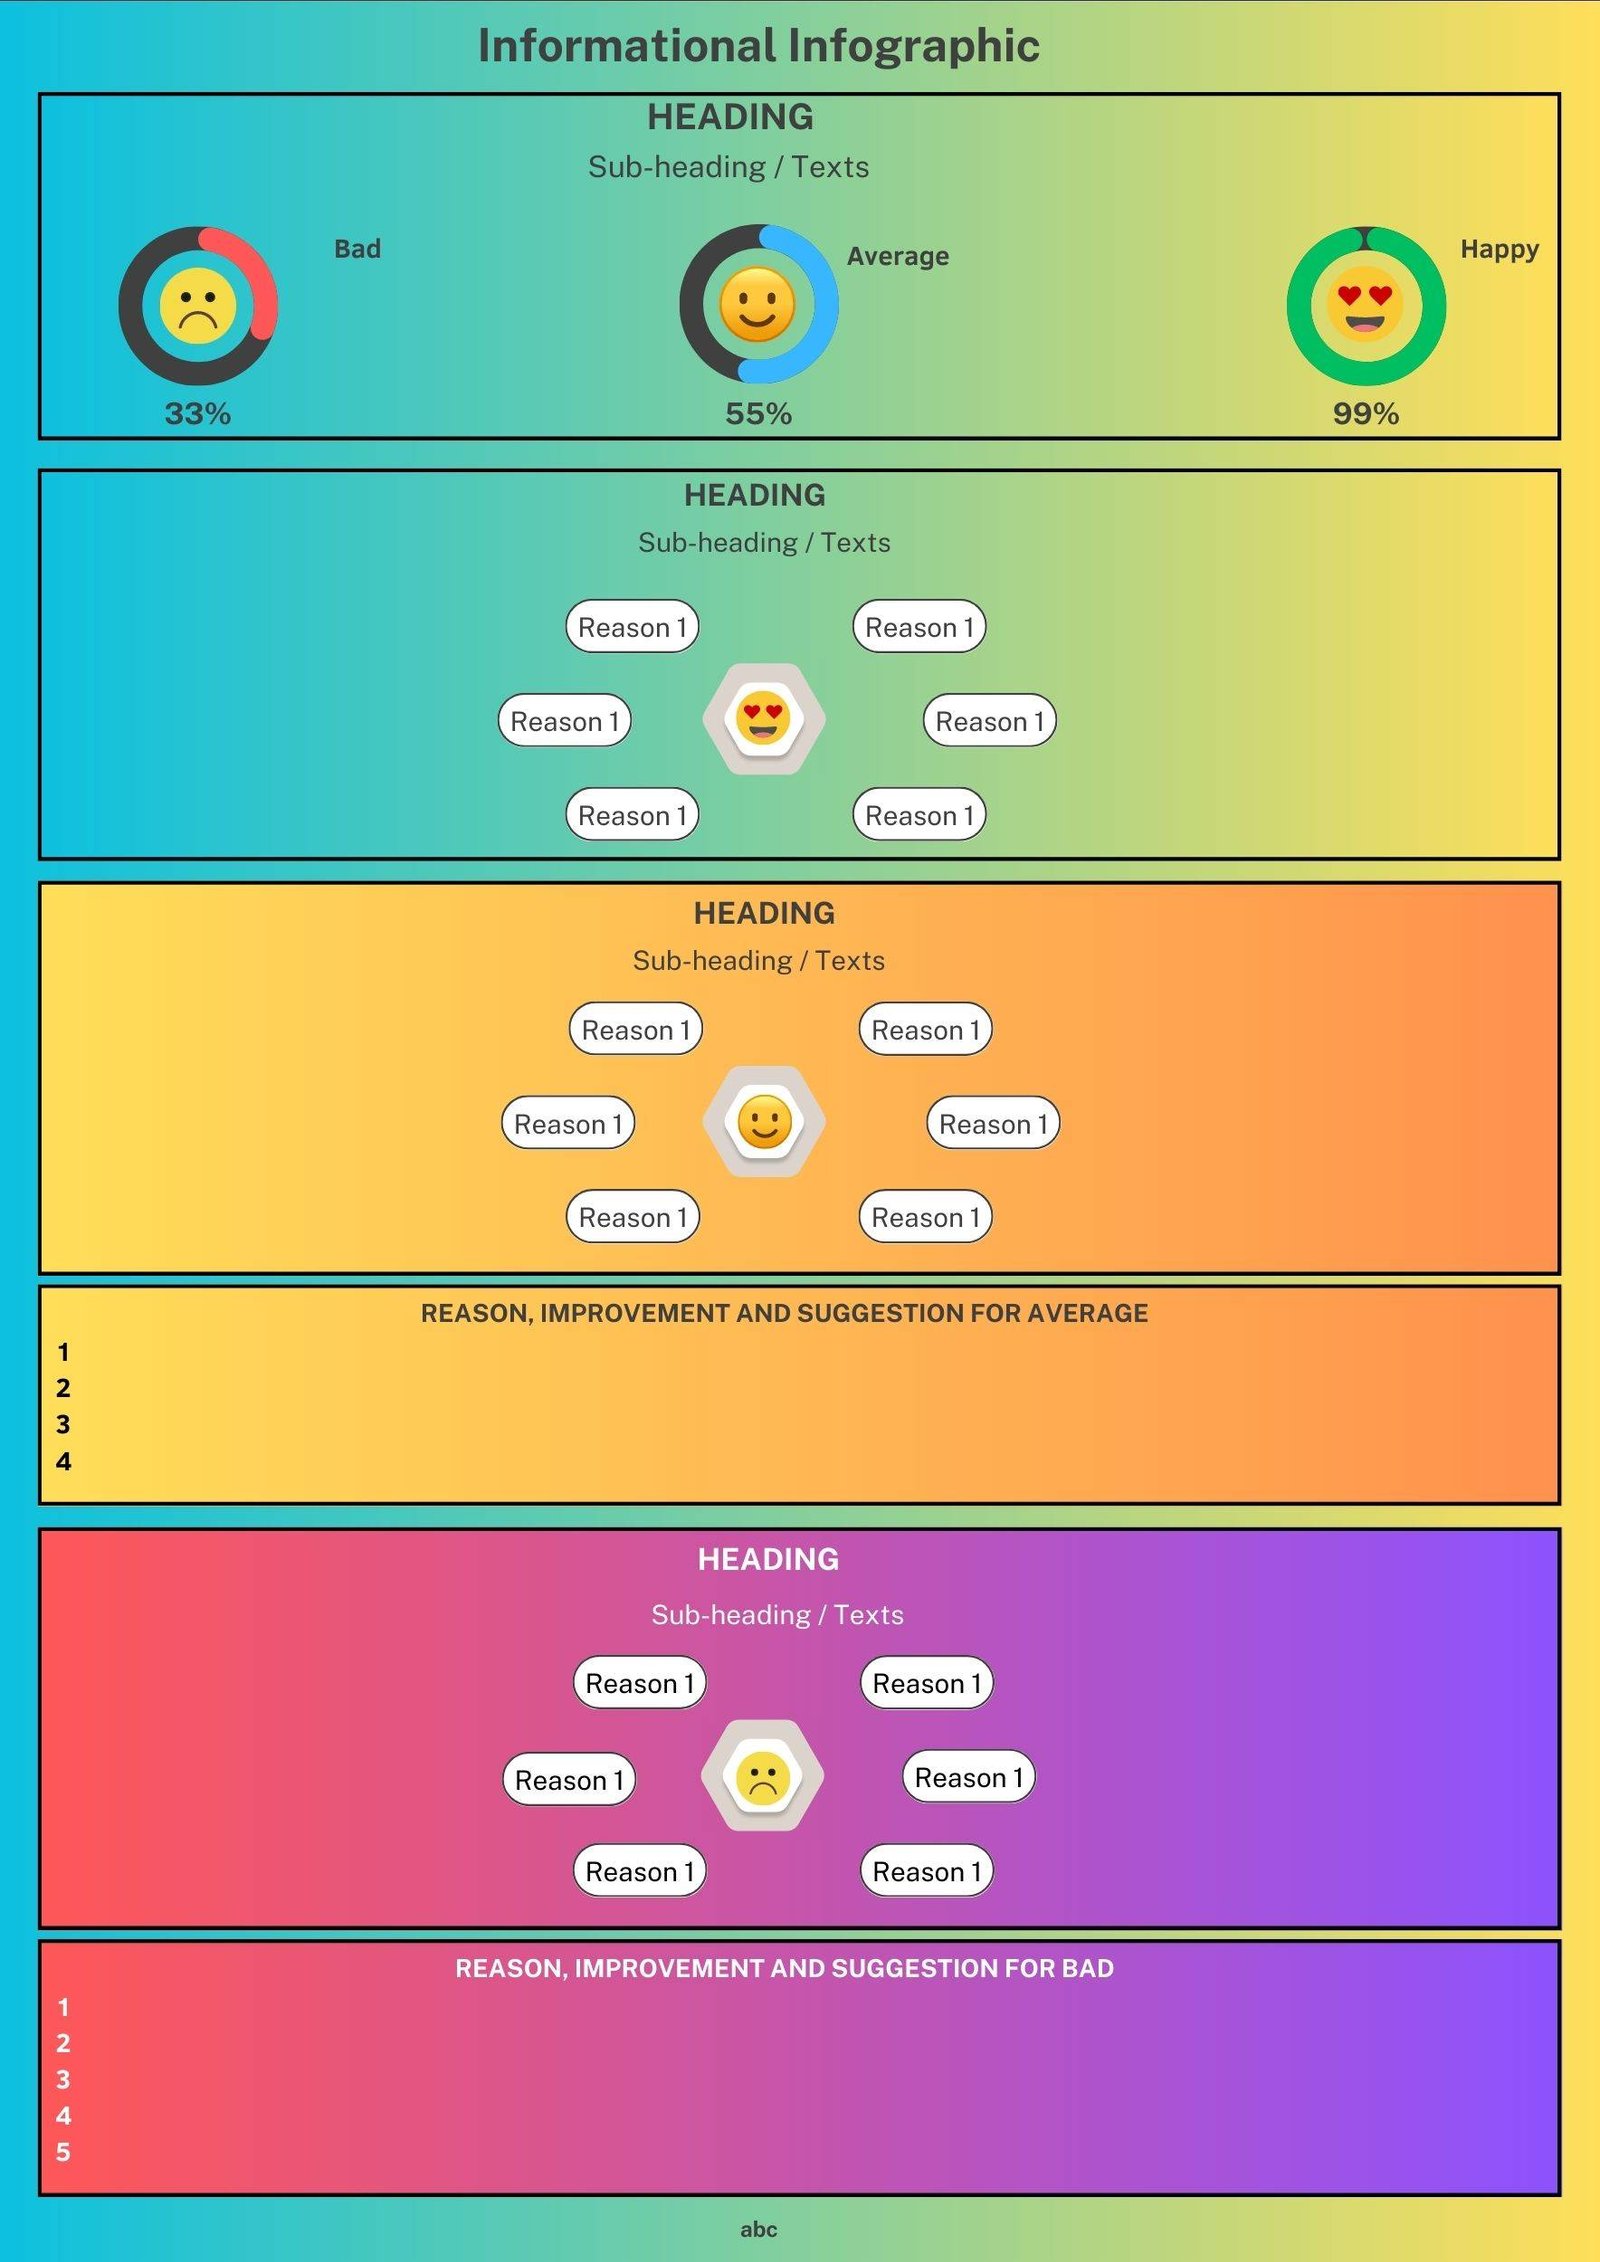
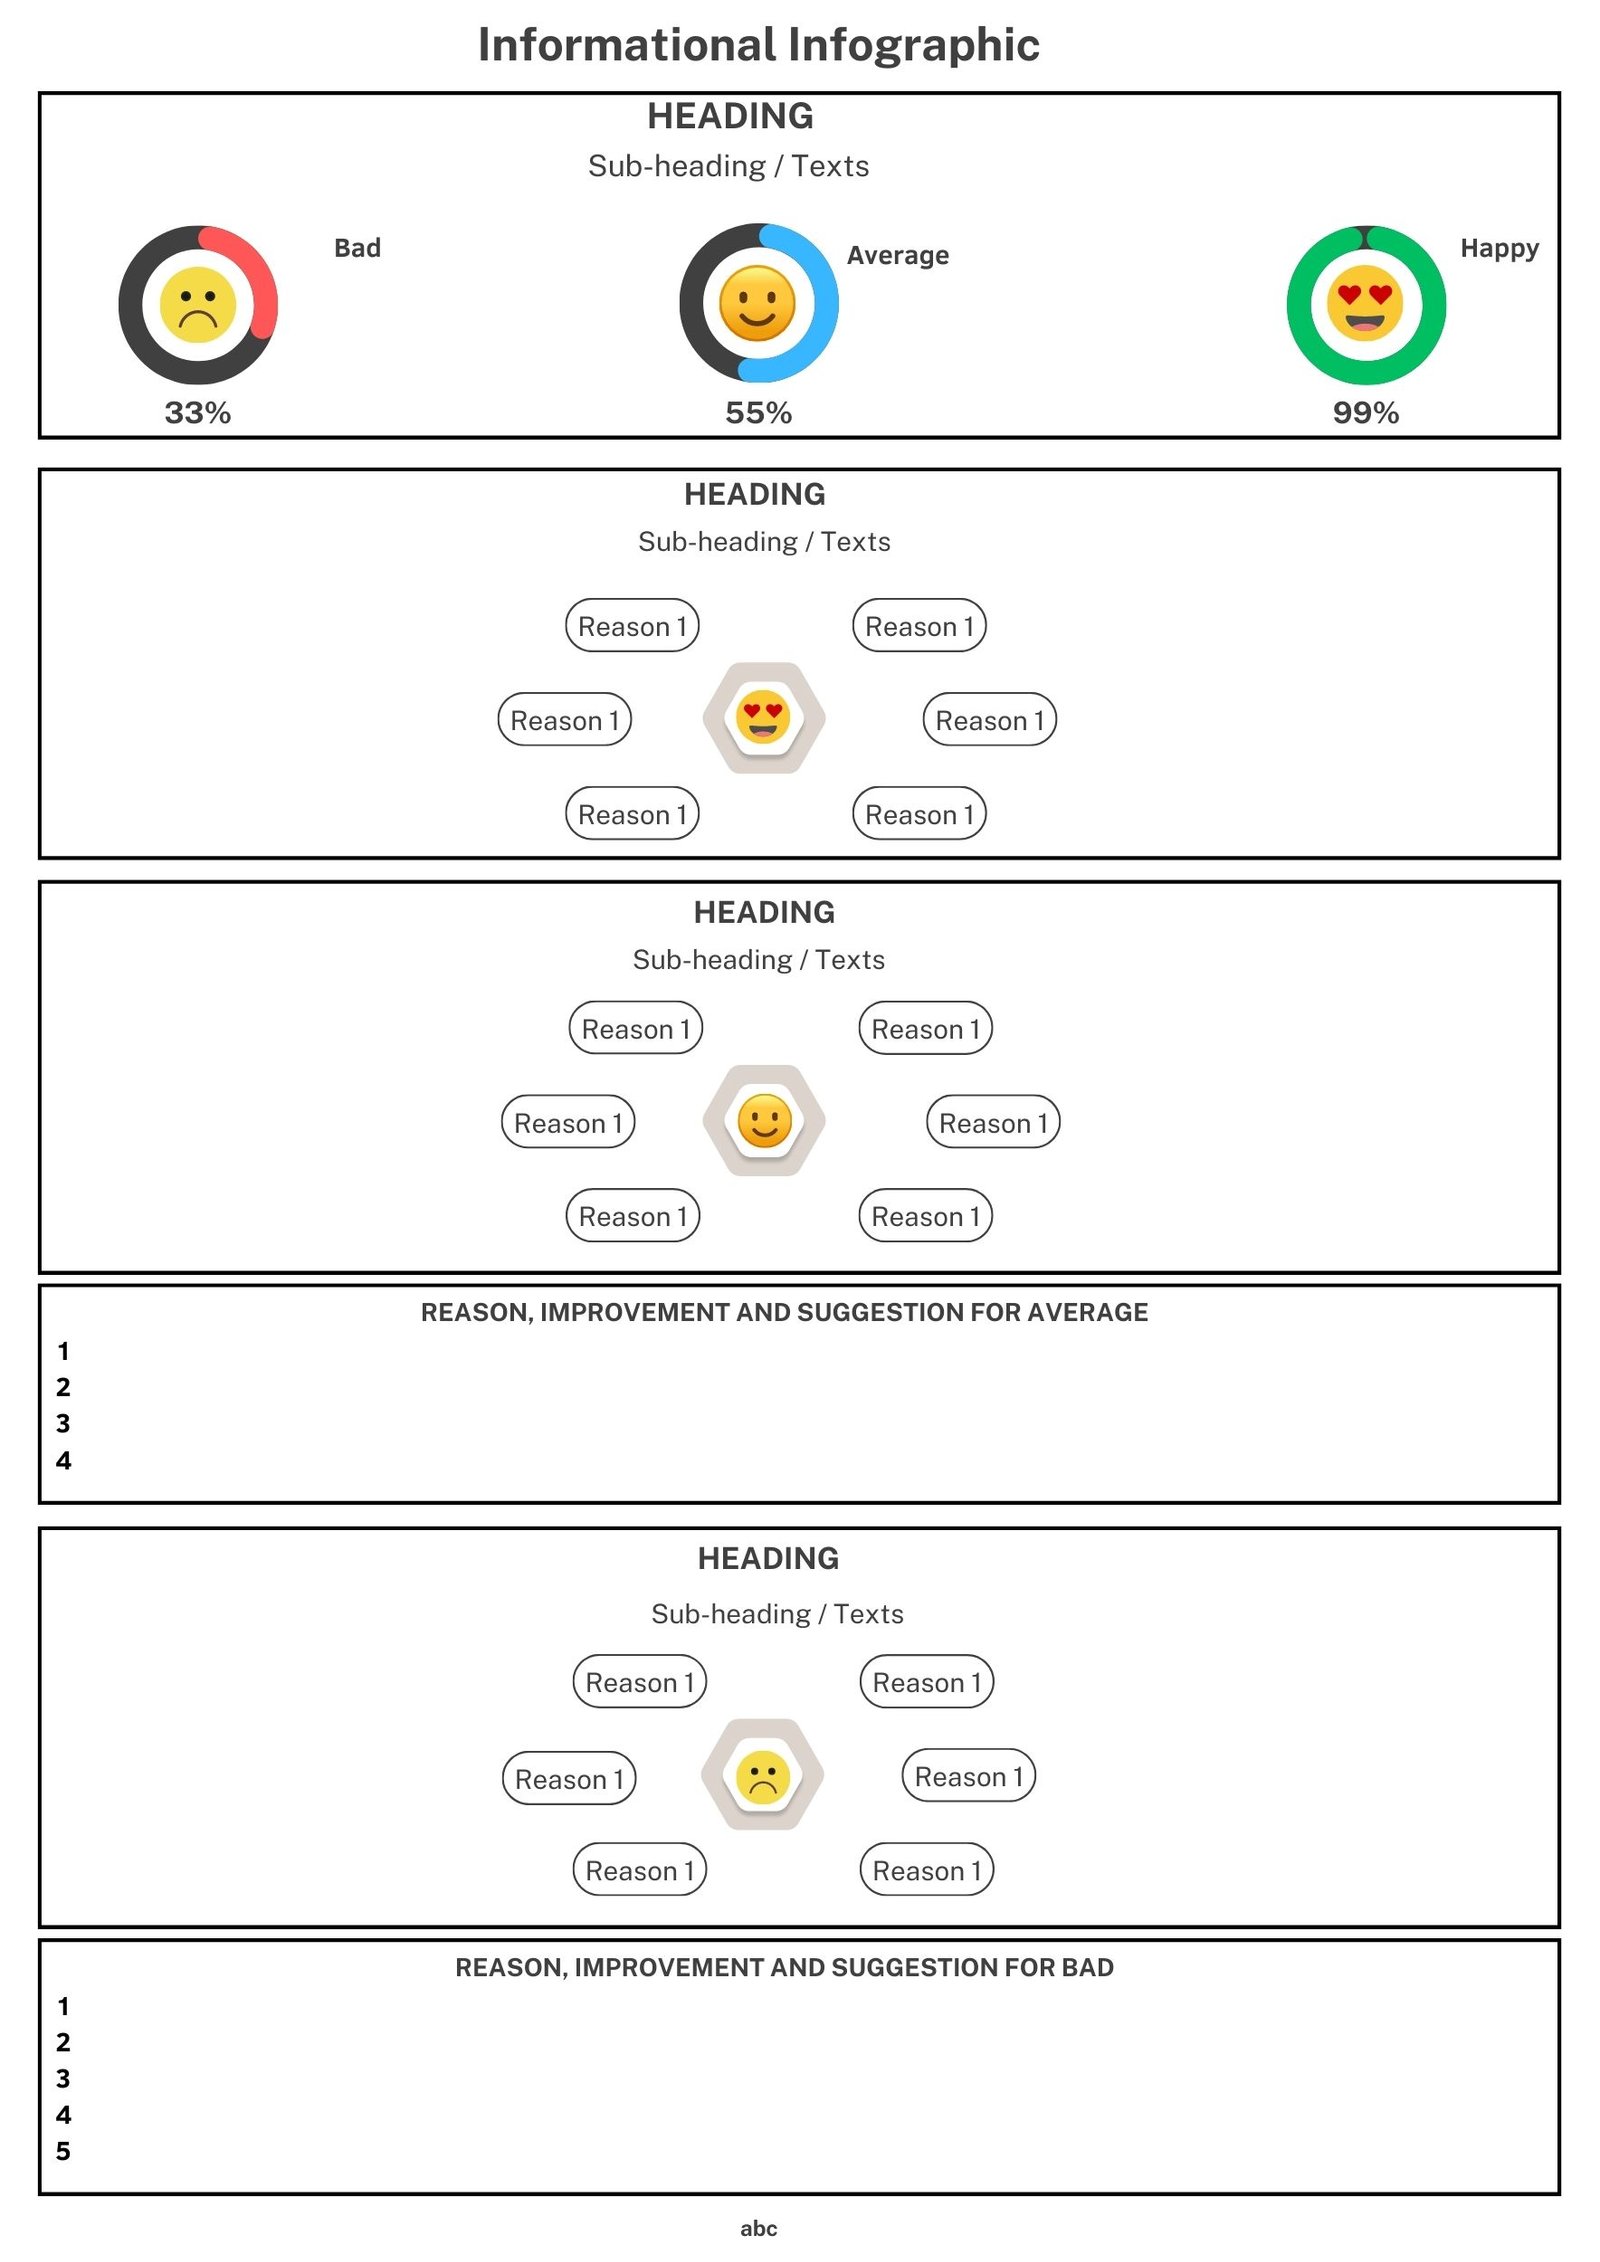
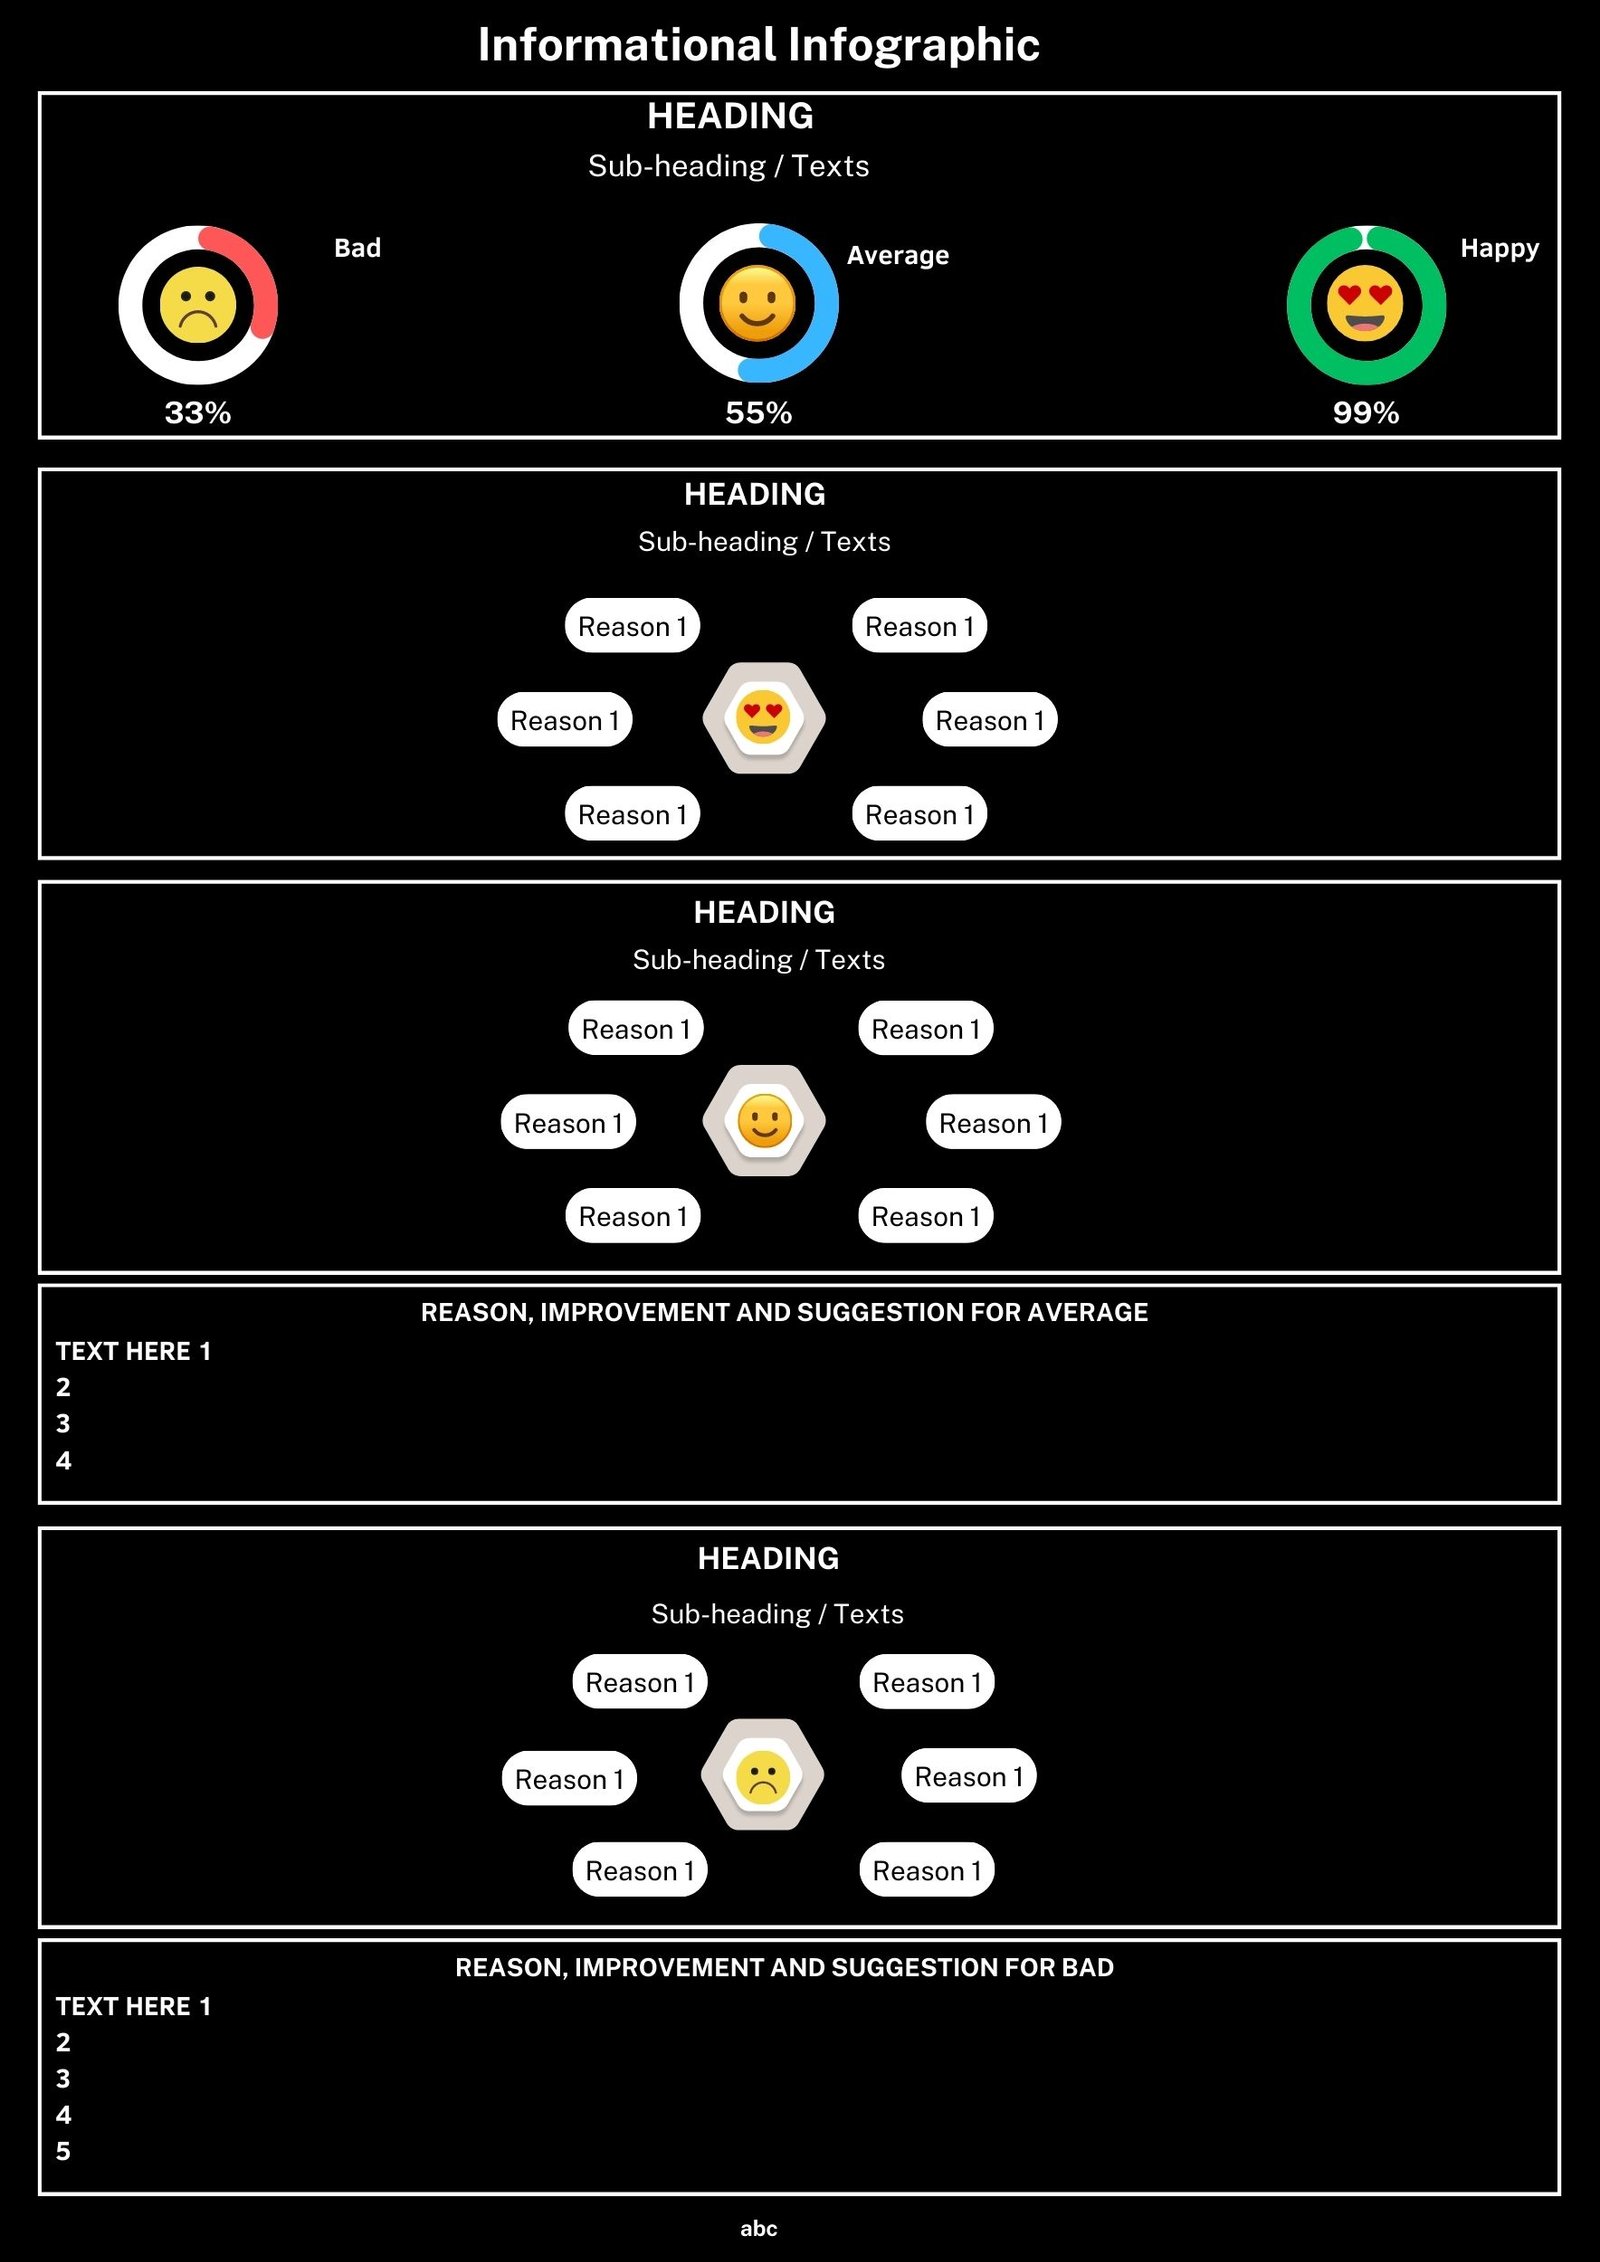
An informational infographic is a visual representation of information or data that uses a combination of text, images, and graphics to tell a story or present a concept. Infographics are a great way to communicate complex information in a way that is easy to understand and remember. They can be used for a variety of purposes.
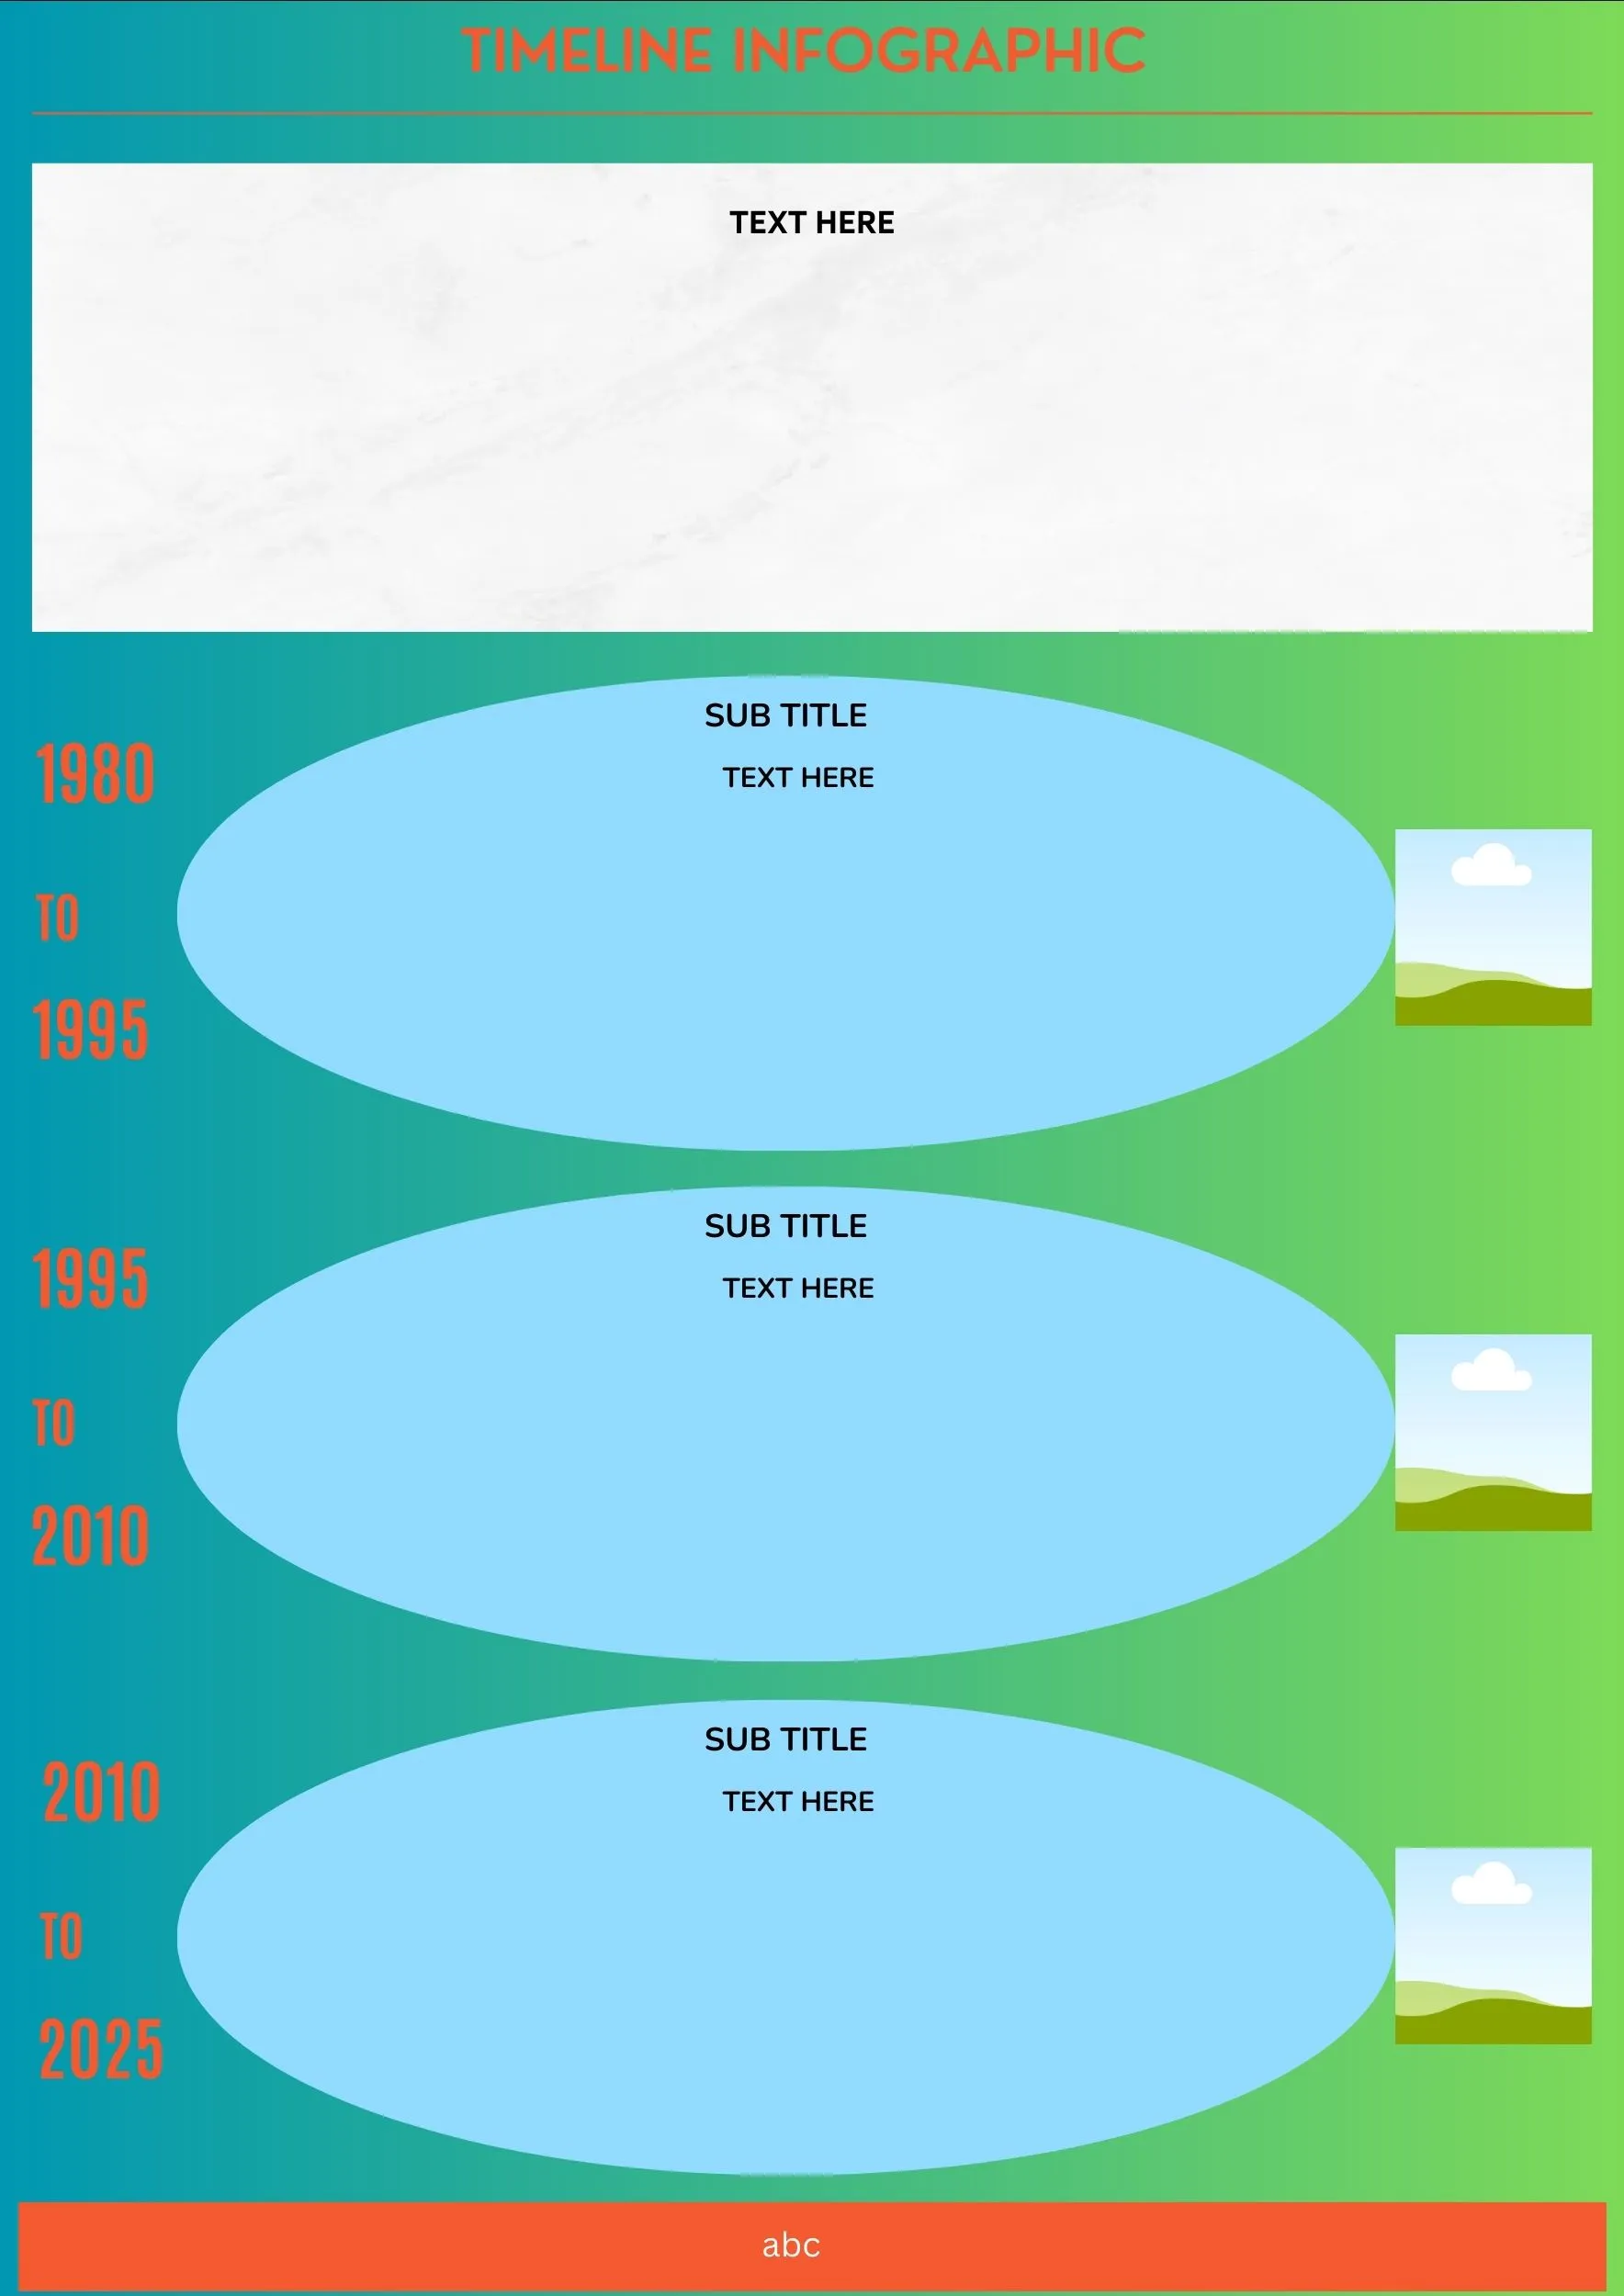
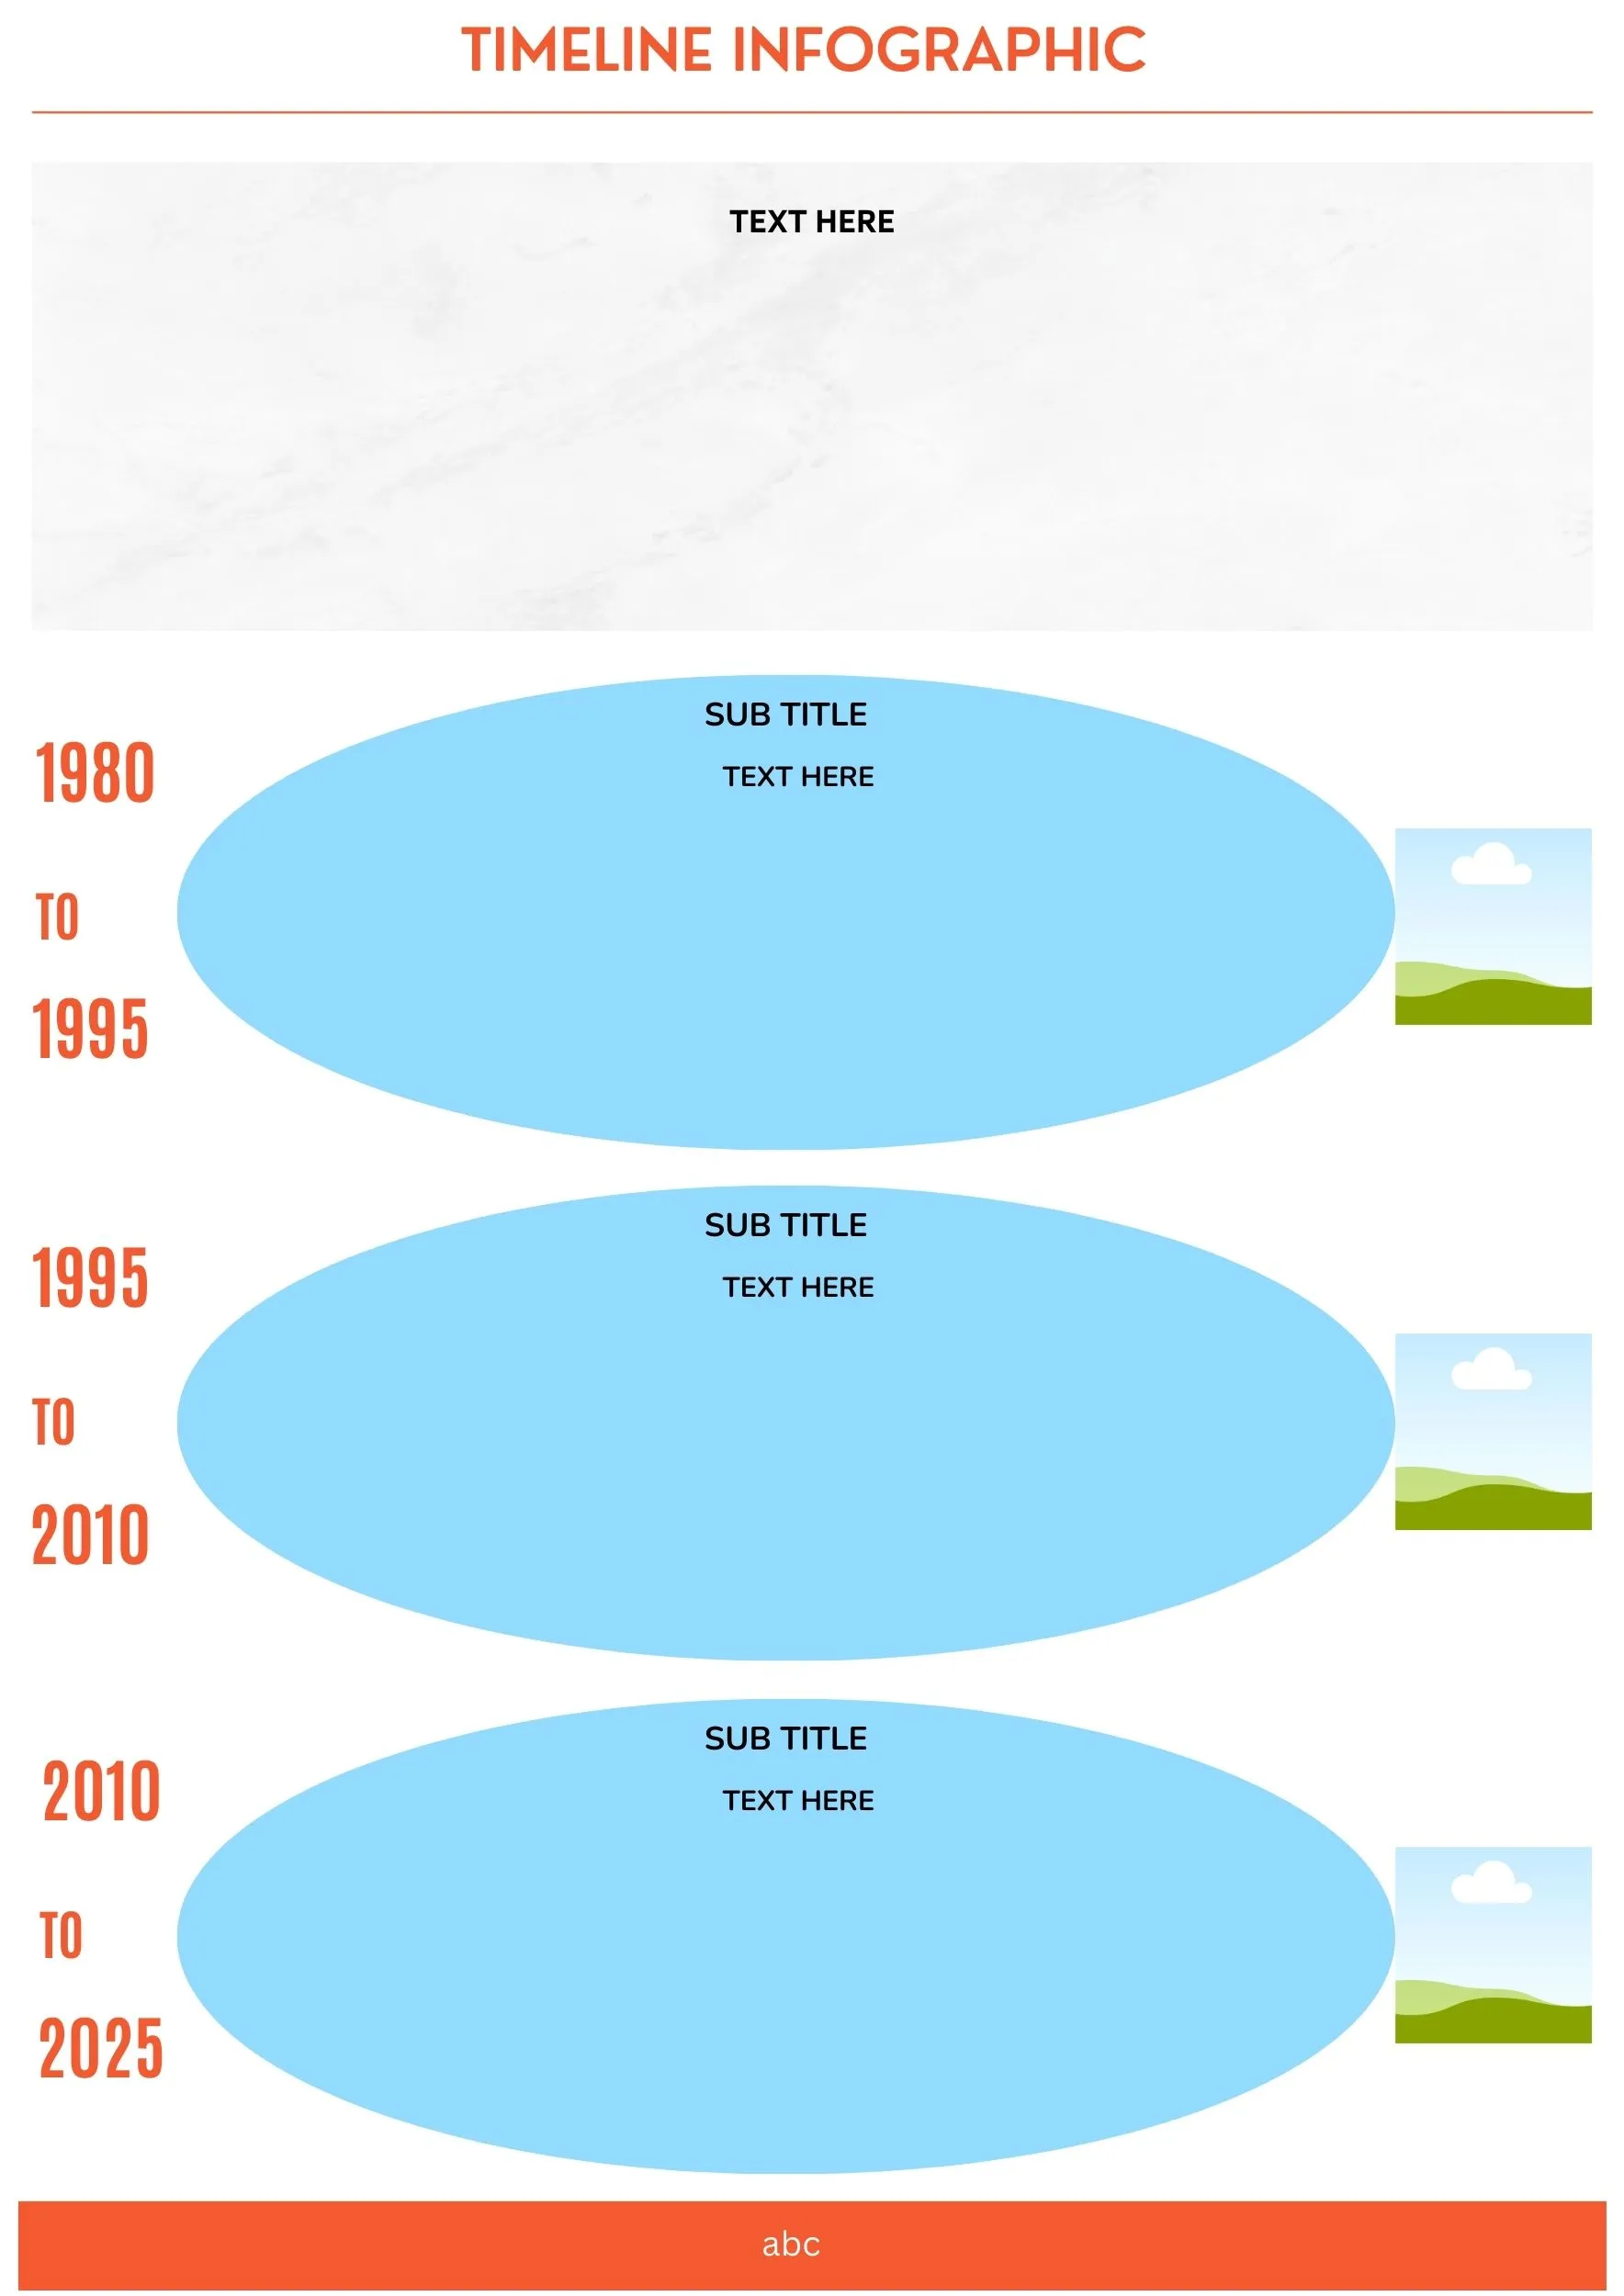
A timeline infographic is a type of infographic that displays a series of events in chronological order. Timeline infographics can be used to illustrate a wide range of topics, such as history, science, business, and personal development. They are a great way to present complex information in a clear and concise way.
A “how-to” infographic is a type of infographic that provides step-by-step instructions on how to do something. They are a great way to share information in a visually appealing and easy-to-understand way. How-to infographics are an effective communication tool, as they provide clear instructions in a concise and comprehensive format. They can also be used to increase engagement on social media platforms, as they are easy to share and repost.
A process infographic is a visual representation of a process, typically broken down into steps or phases. It can be used to explain a complex process in a clear and concise way. Process infographics are often used in business, education, and marketing.
A comparison infographic is a type of infographic that visually compares two or more things. It can be used to compare products, services, people, places, or anything else that can be broken down into different categories. Comparison infographics are a great way to help people understand the similarities and differences between different options. They can also be used to make a persuasive argument for one option over another.
A location infographic is a type of infographic that uses maps to convey information. They can be used to show the location of businesses, events, or other data points. Map infographics can be very effective at communicating information because they are easy to understand and visually appealing. They can also be used to compare different geographical areas, show customer demographics or illustrate the spread of an epidemic. Additionally, they can be used to create interactive experiences, allowing users to explore the data points themselves.
A flowchart infographic is a visual representation of a process or workflow. It uses a combination of shapes, arrows, and text to show the steps involved in a process. Flowchart infographics can be used to communicate complex information in a clear and concise way. They can also be used to help people understand how different parts of a process fit together.
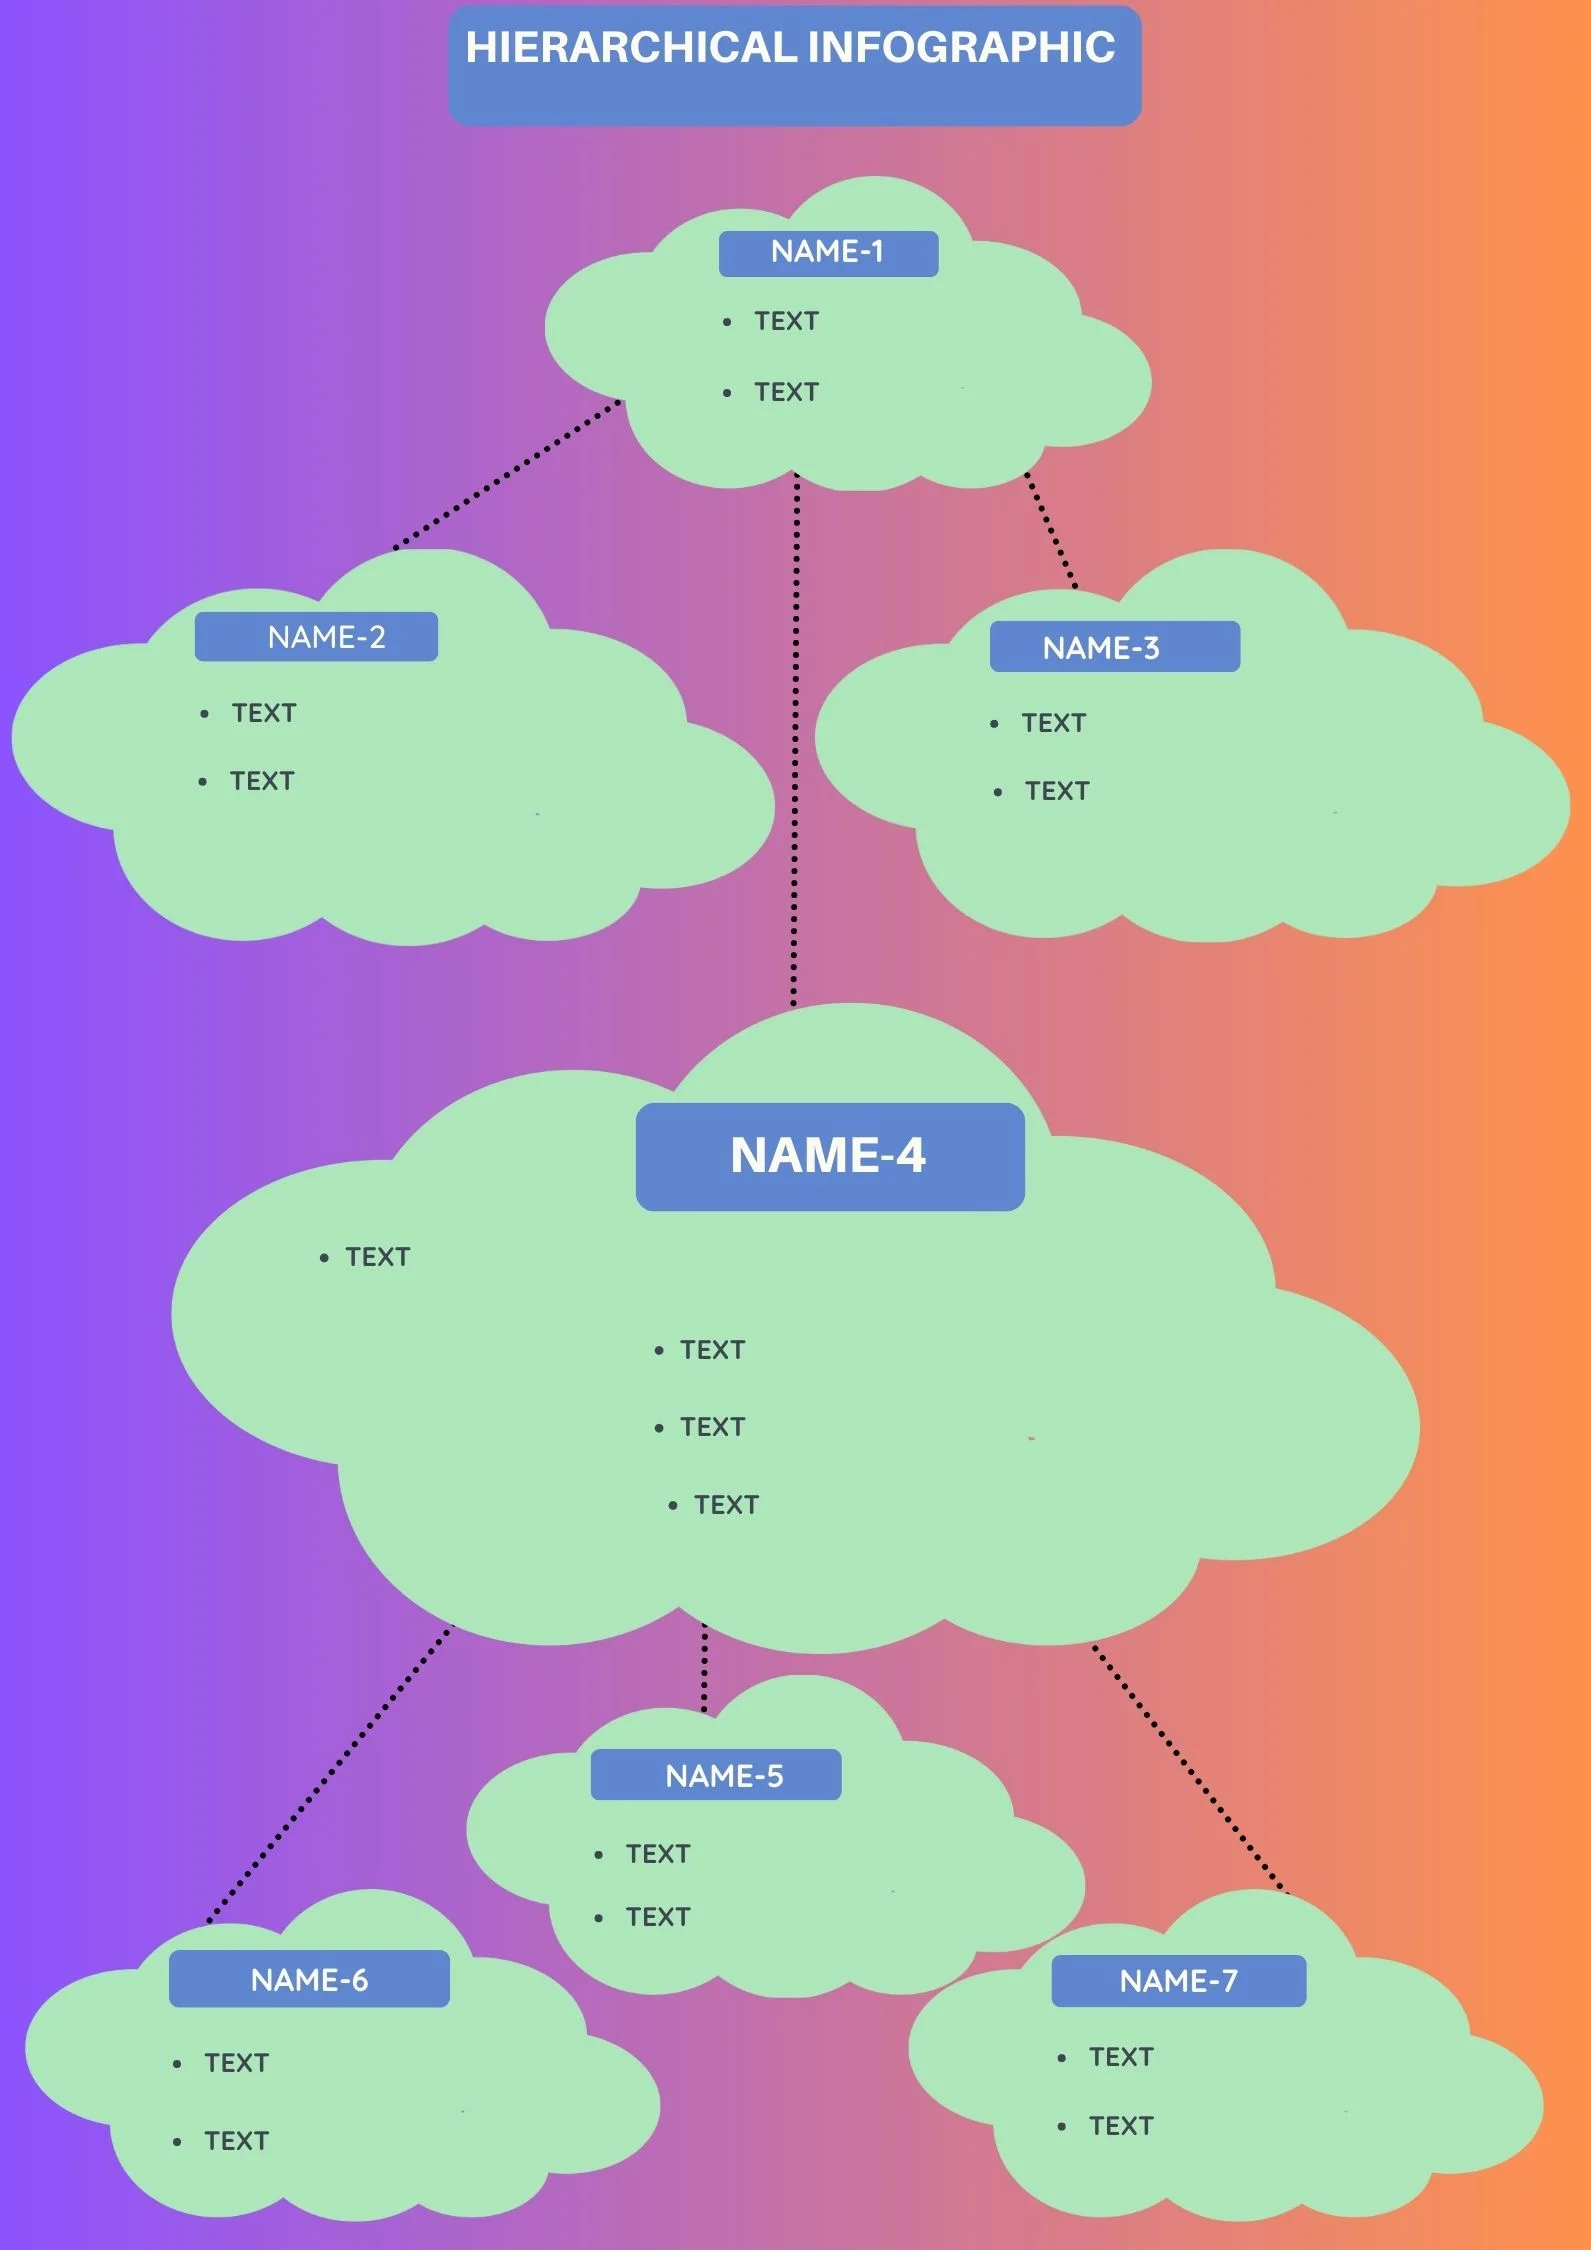
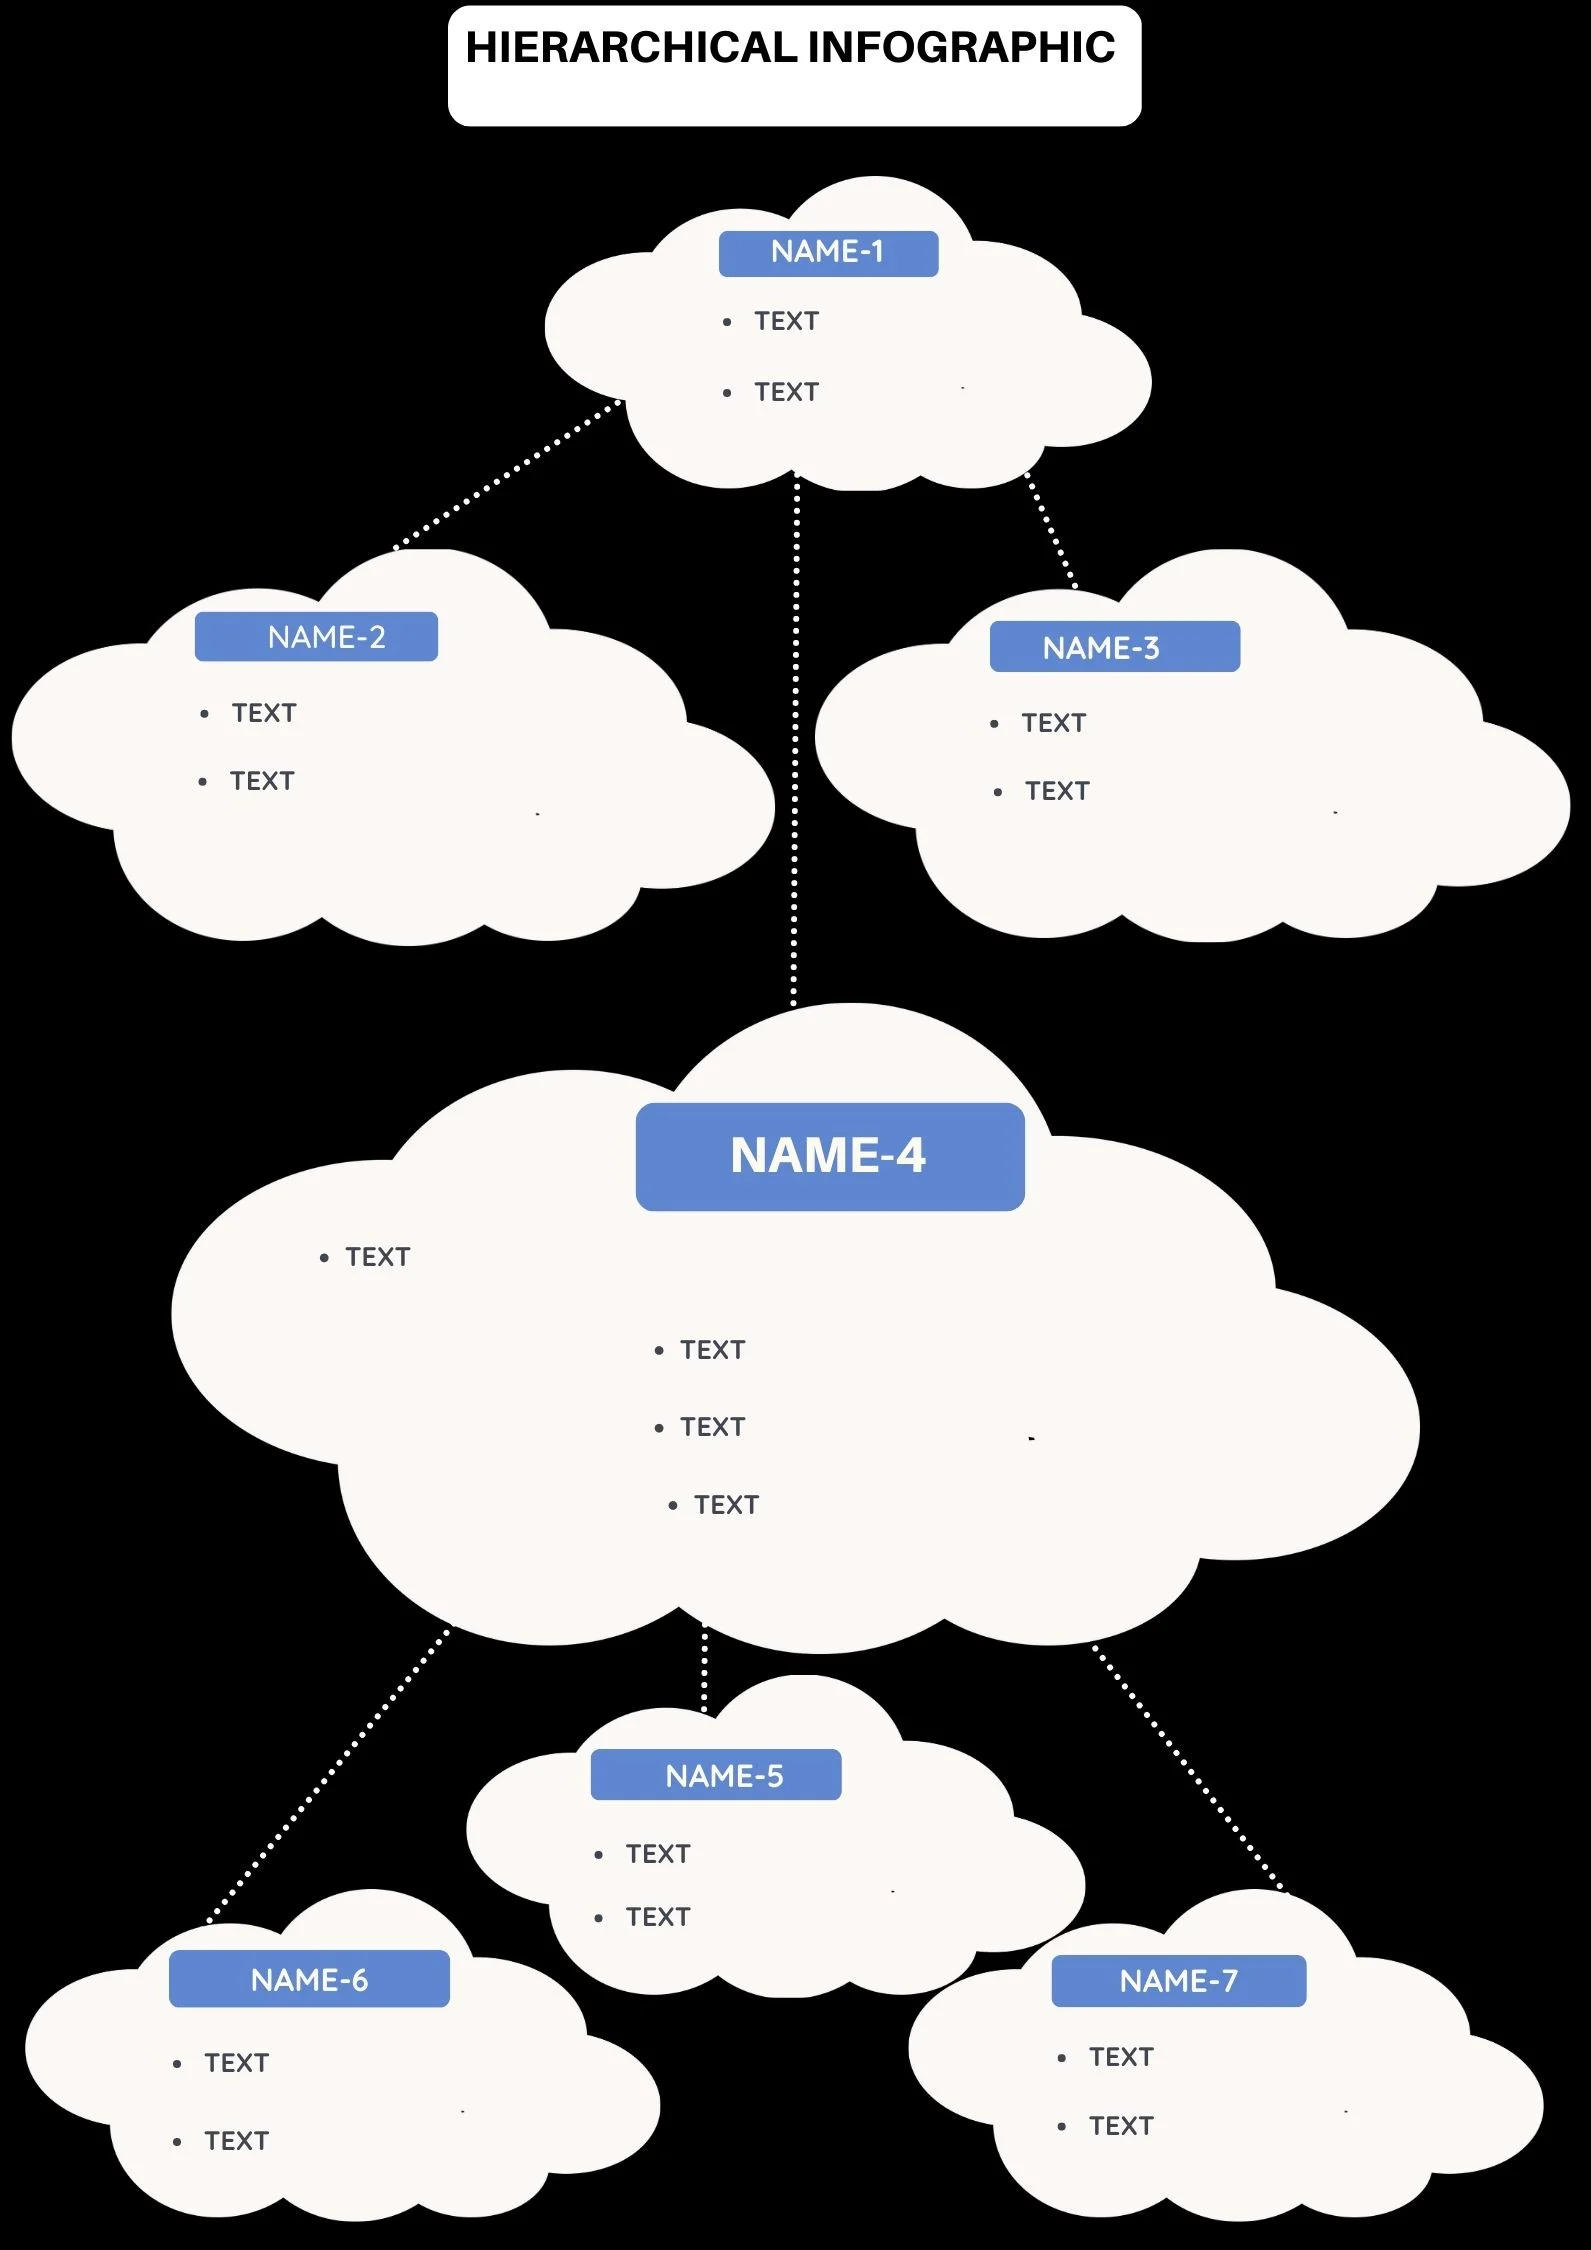
A hierarchical infographic is a type of infographic that uses shapes and colors to show the relationship between different levels of information. The most common type of hierarchical infographic is a pyramid, where the most important information is at the top and the least important information is at the bottom. Other common shapes used in hierarchical infographics include trees, flowcharts, and Venn diagrams.
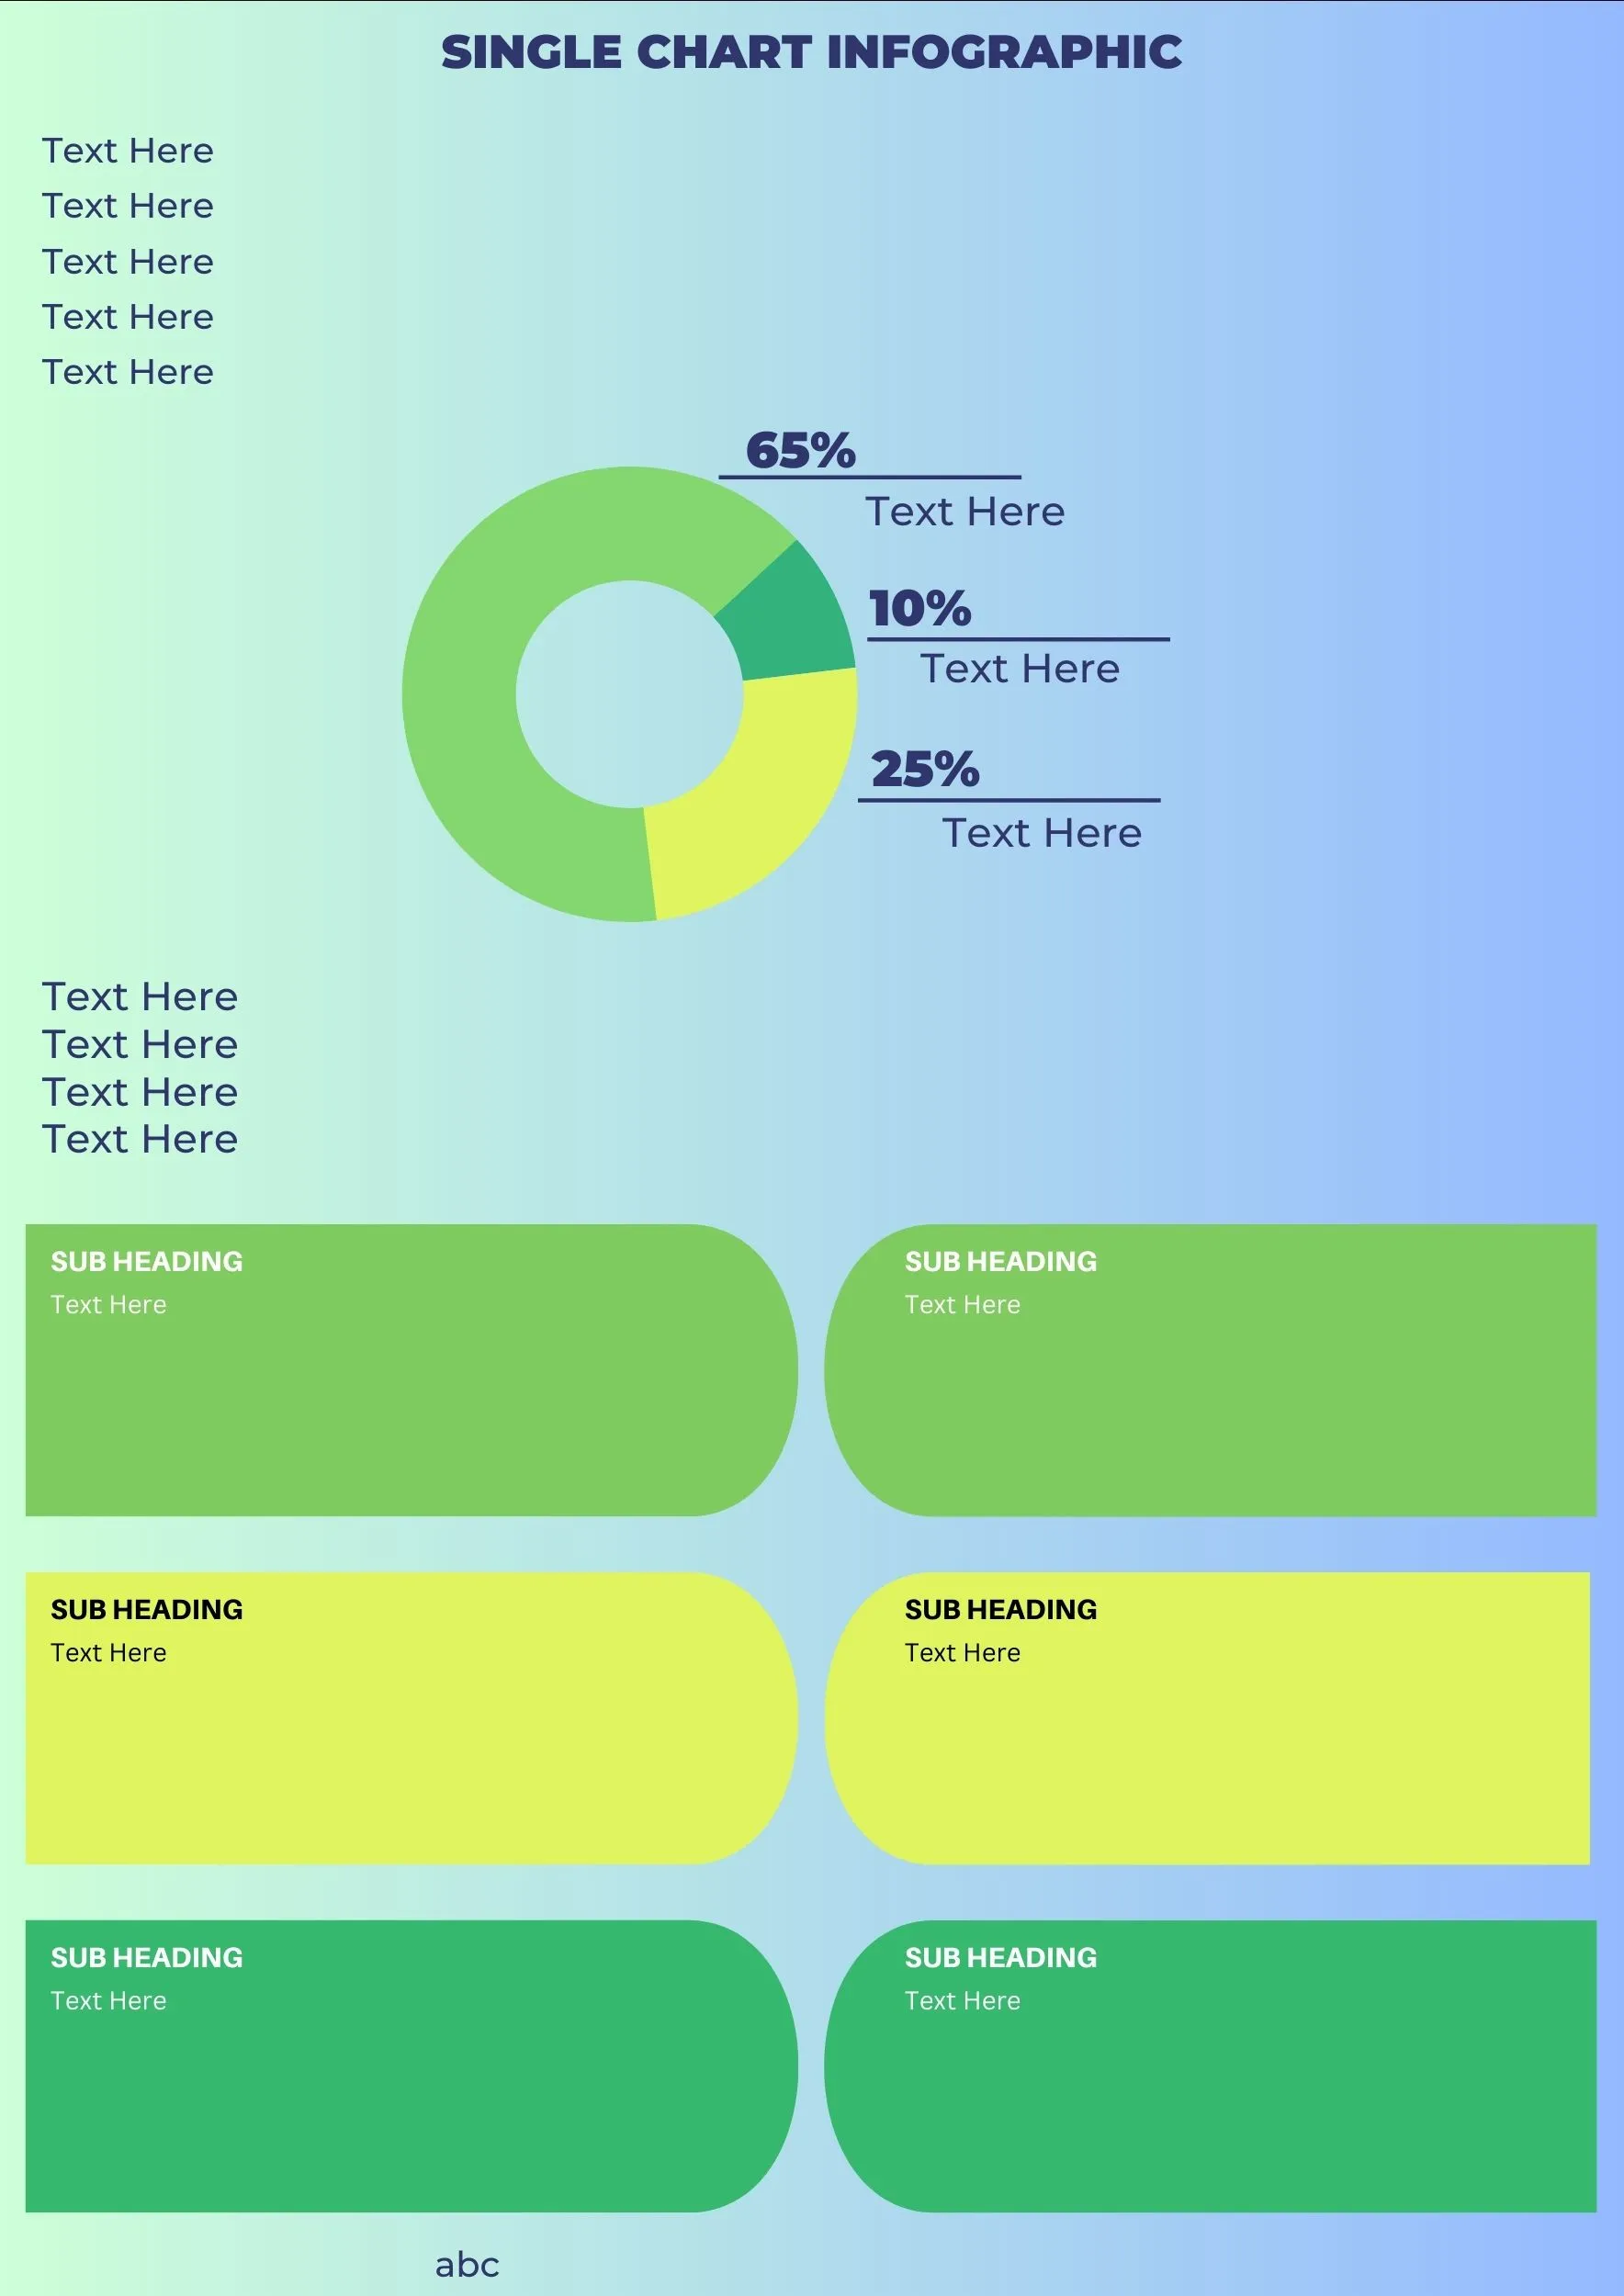
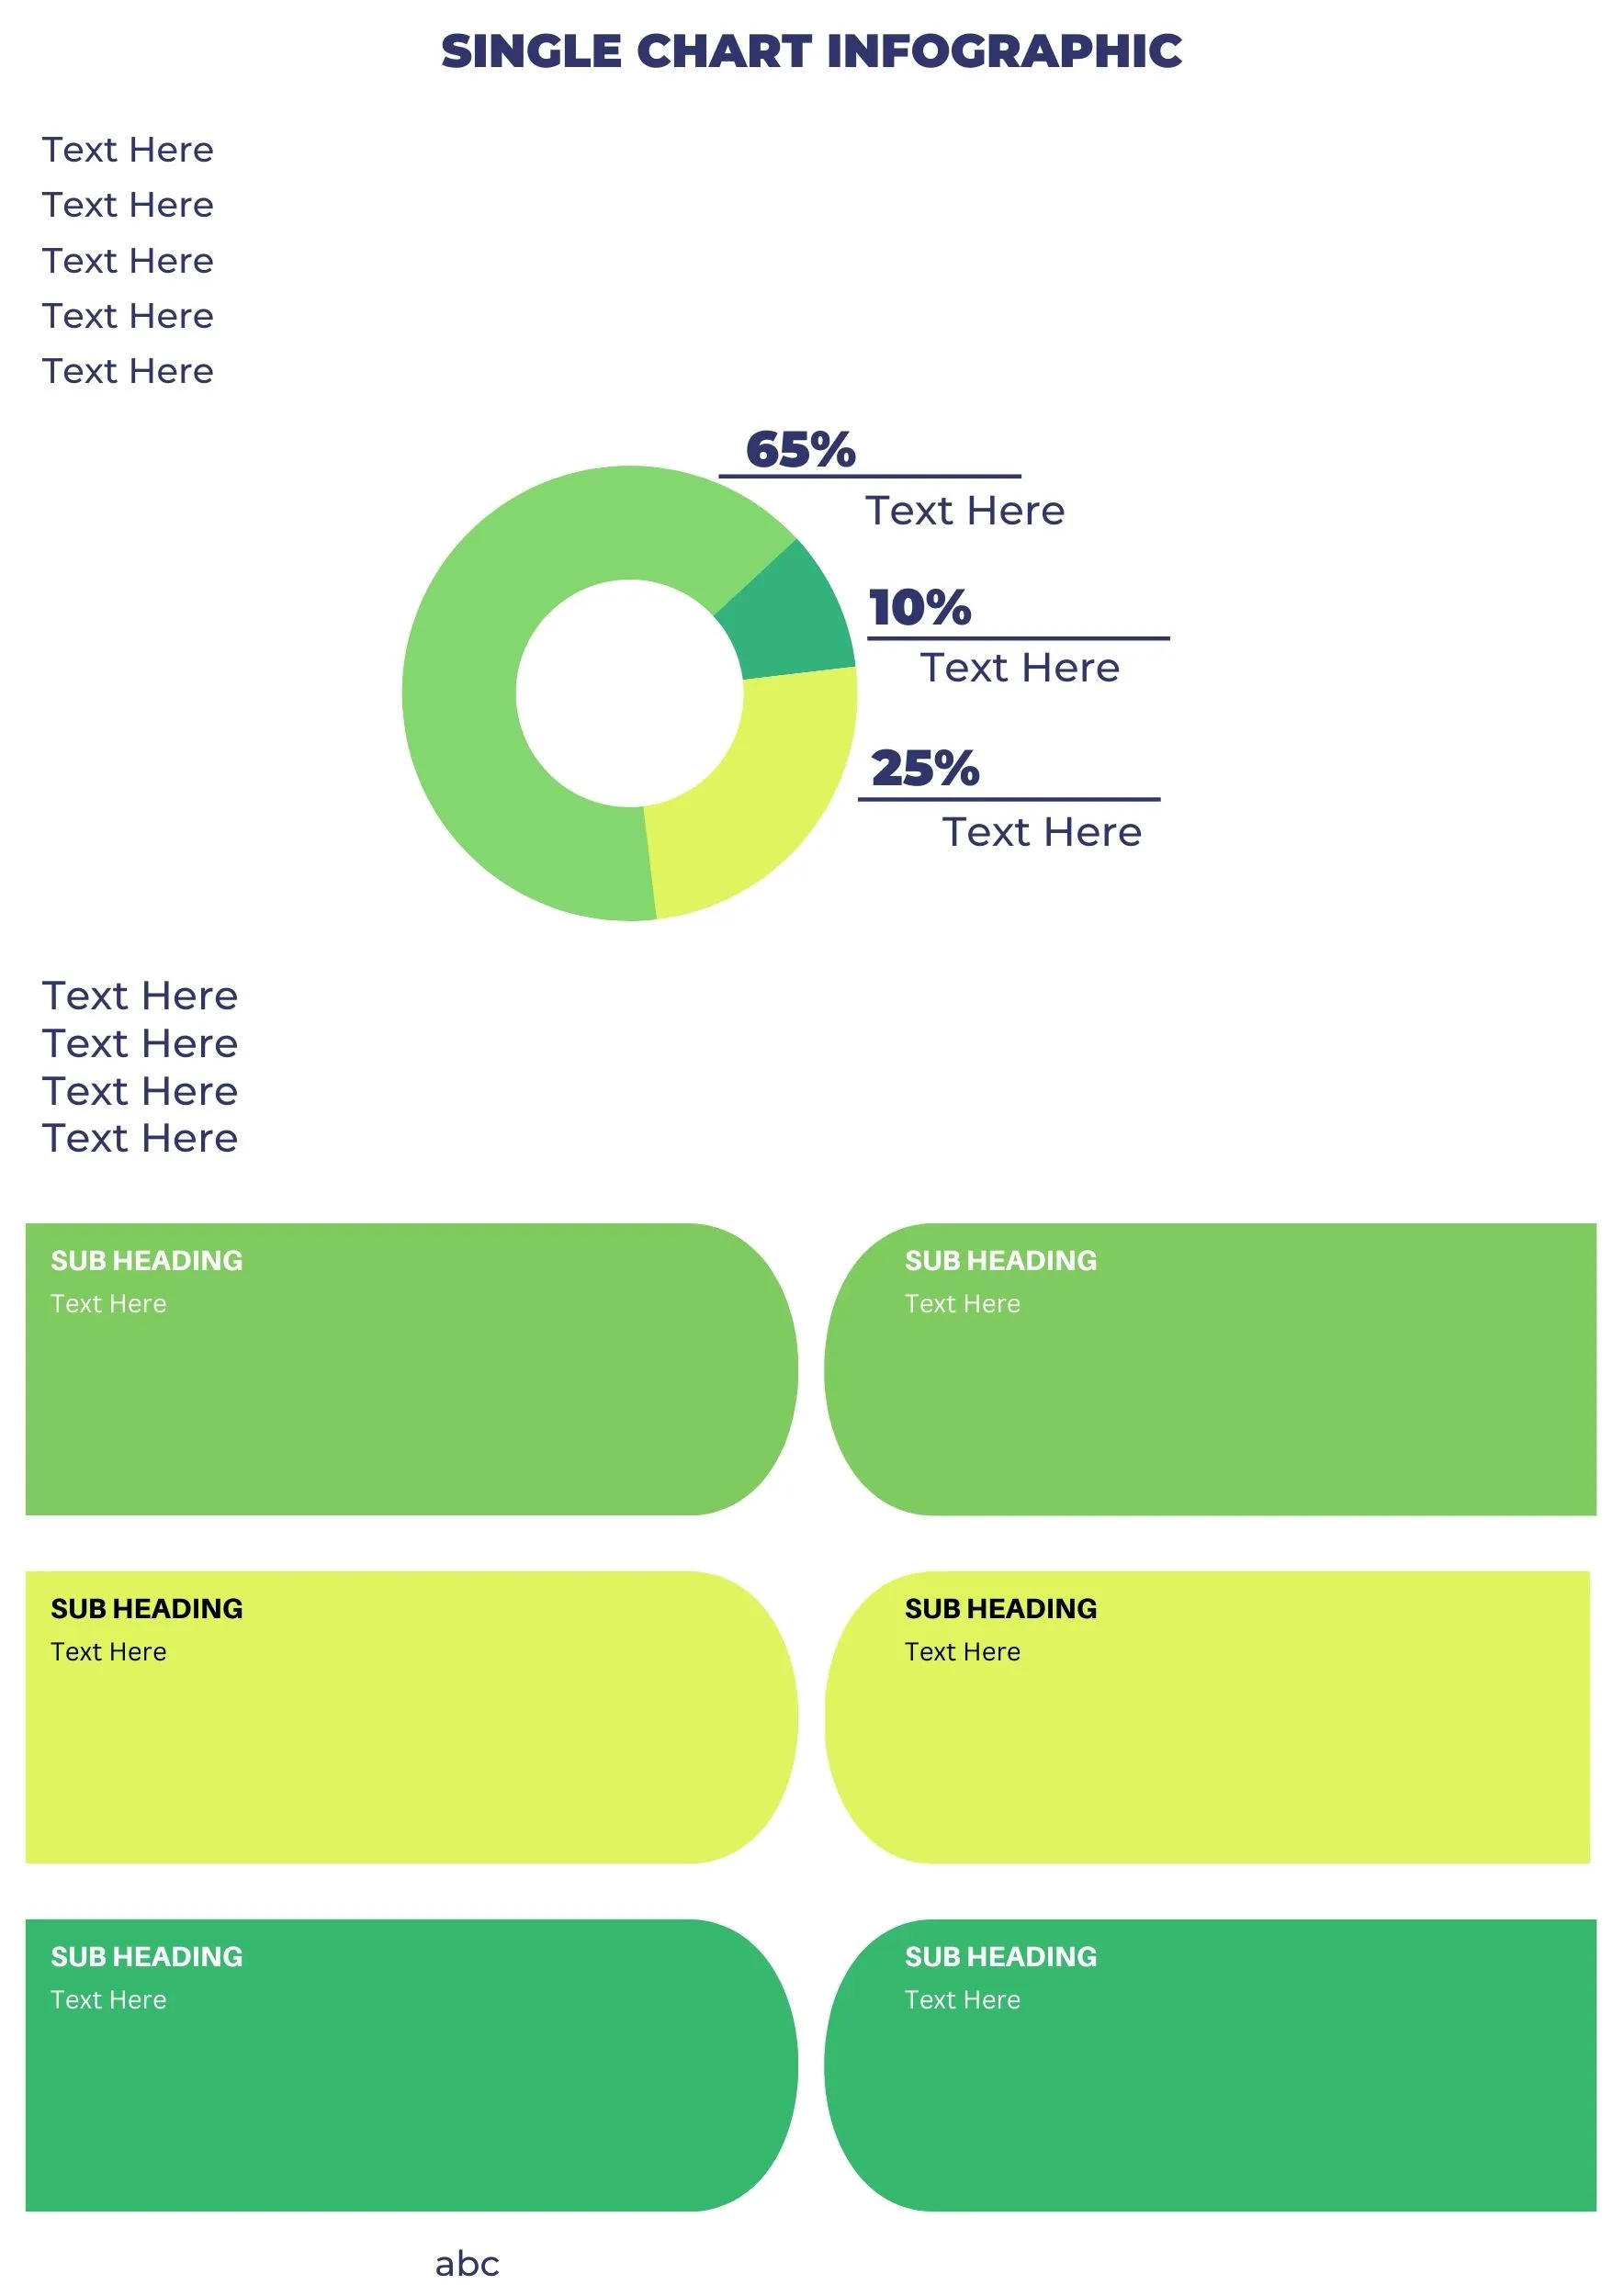
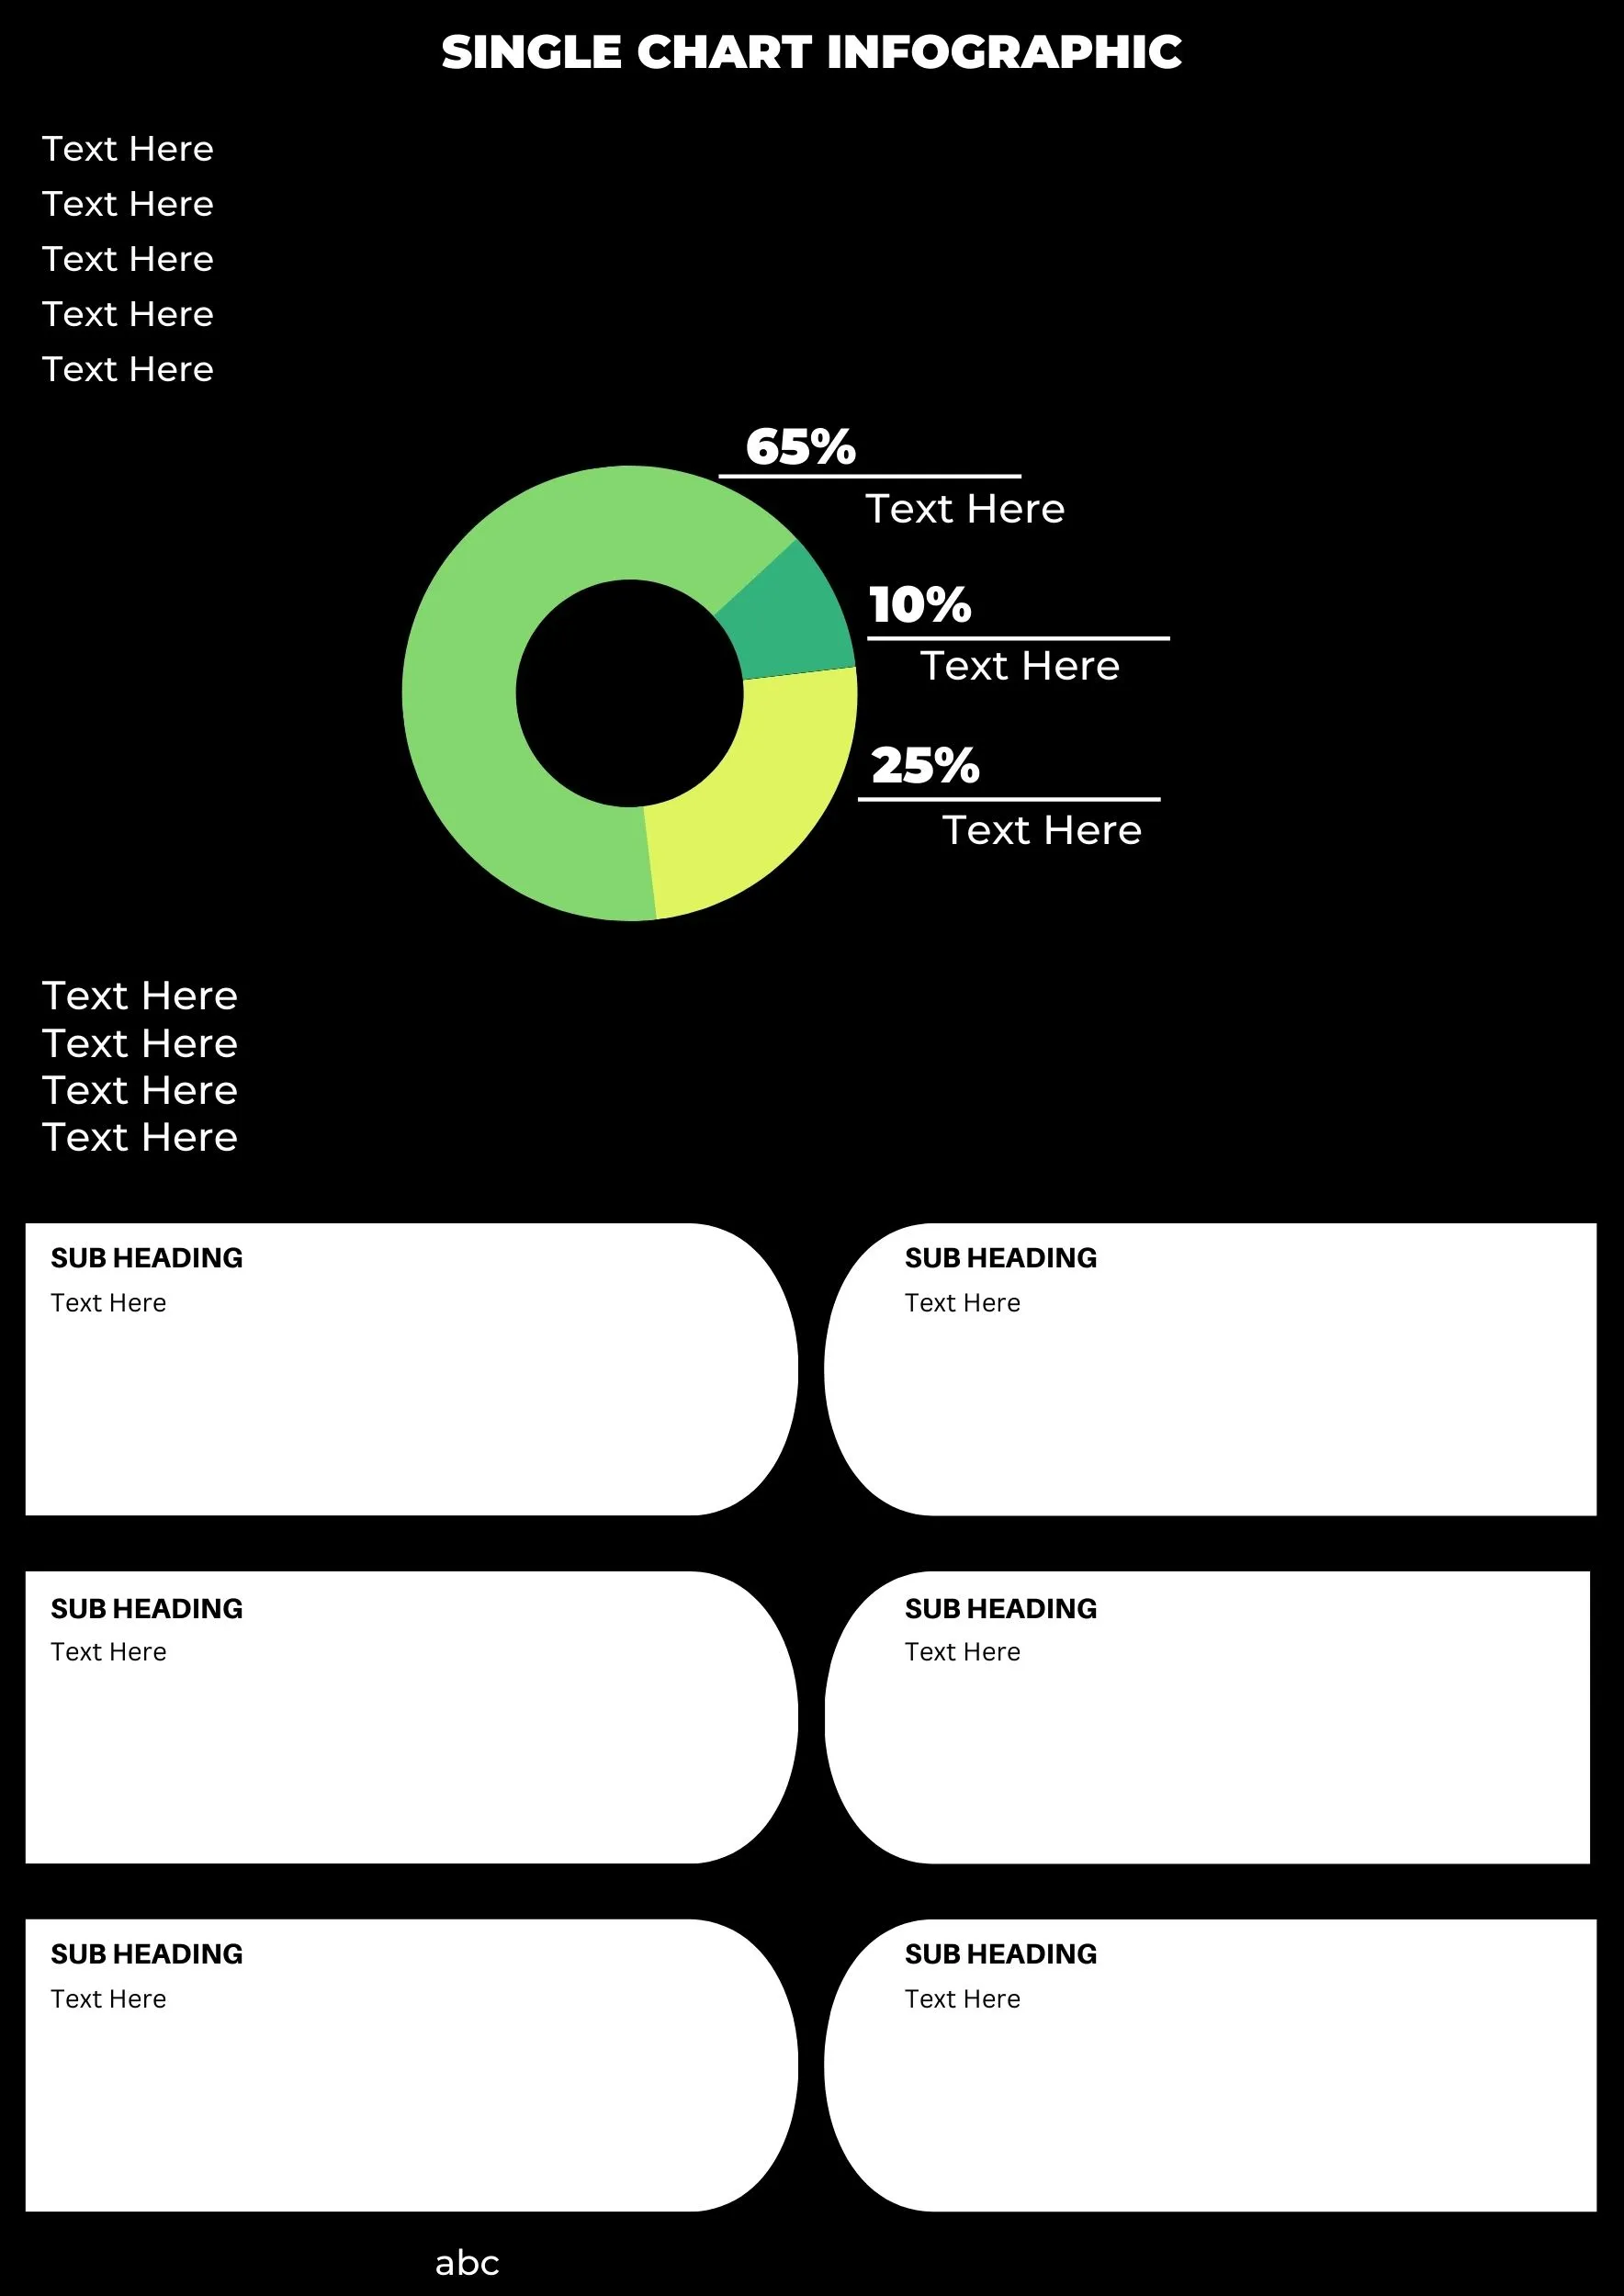
A single chart infographic is a type of infographic that uses only one chart to visualize data. This type of infographic is often used to present simple data sets or to highlight a specific trend or statistic. Single chart infographics can be effective in communicating data because they are easy to understand and visually appealing.
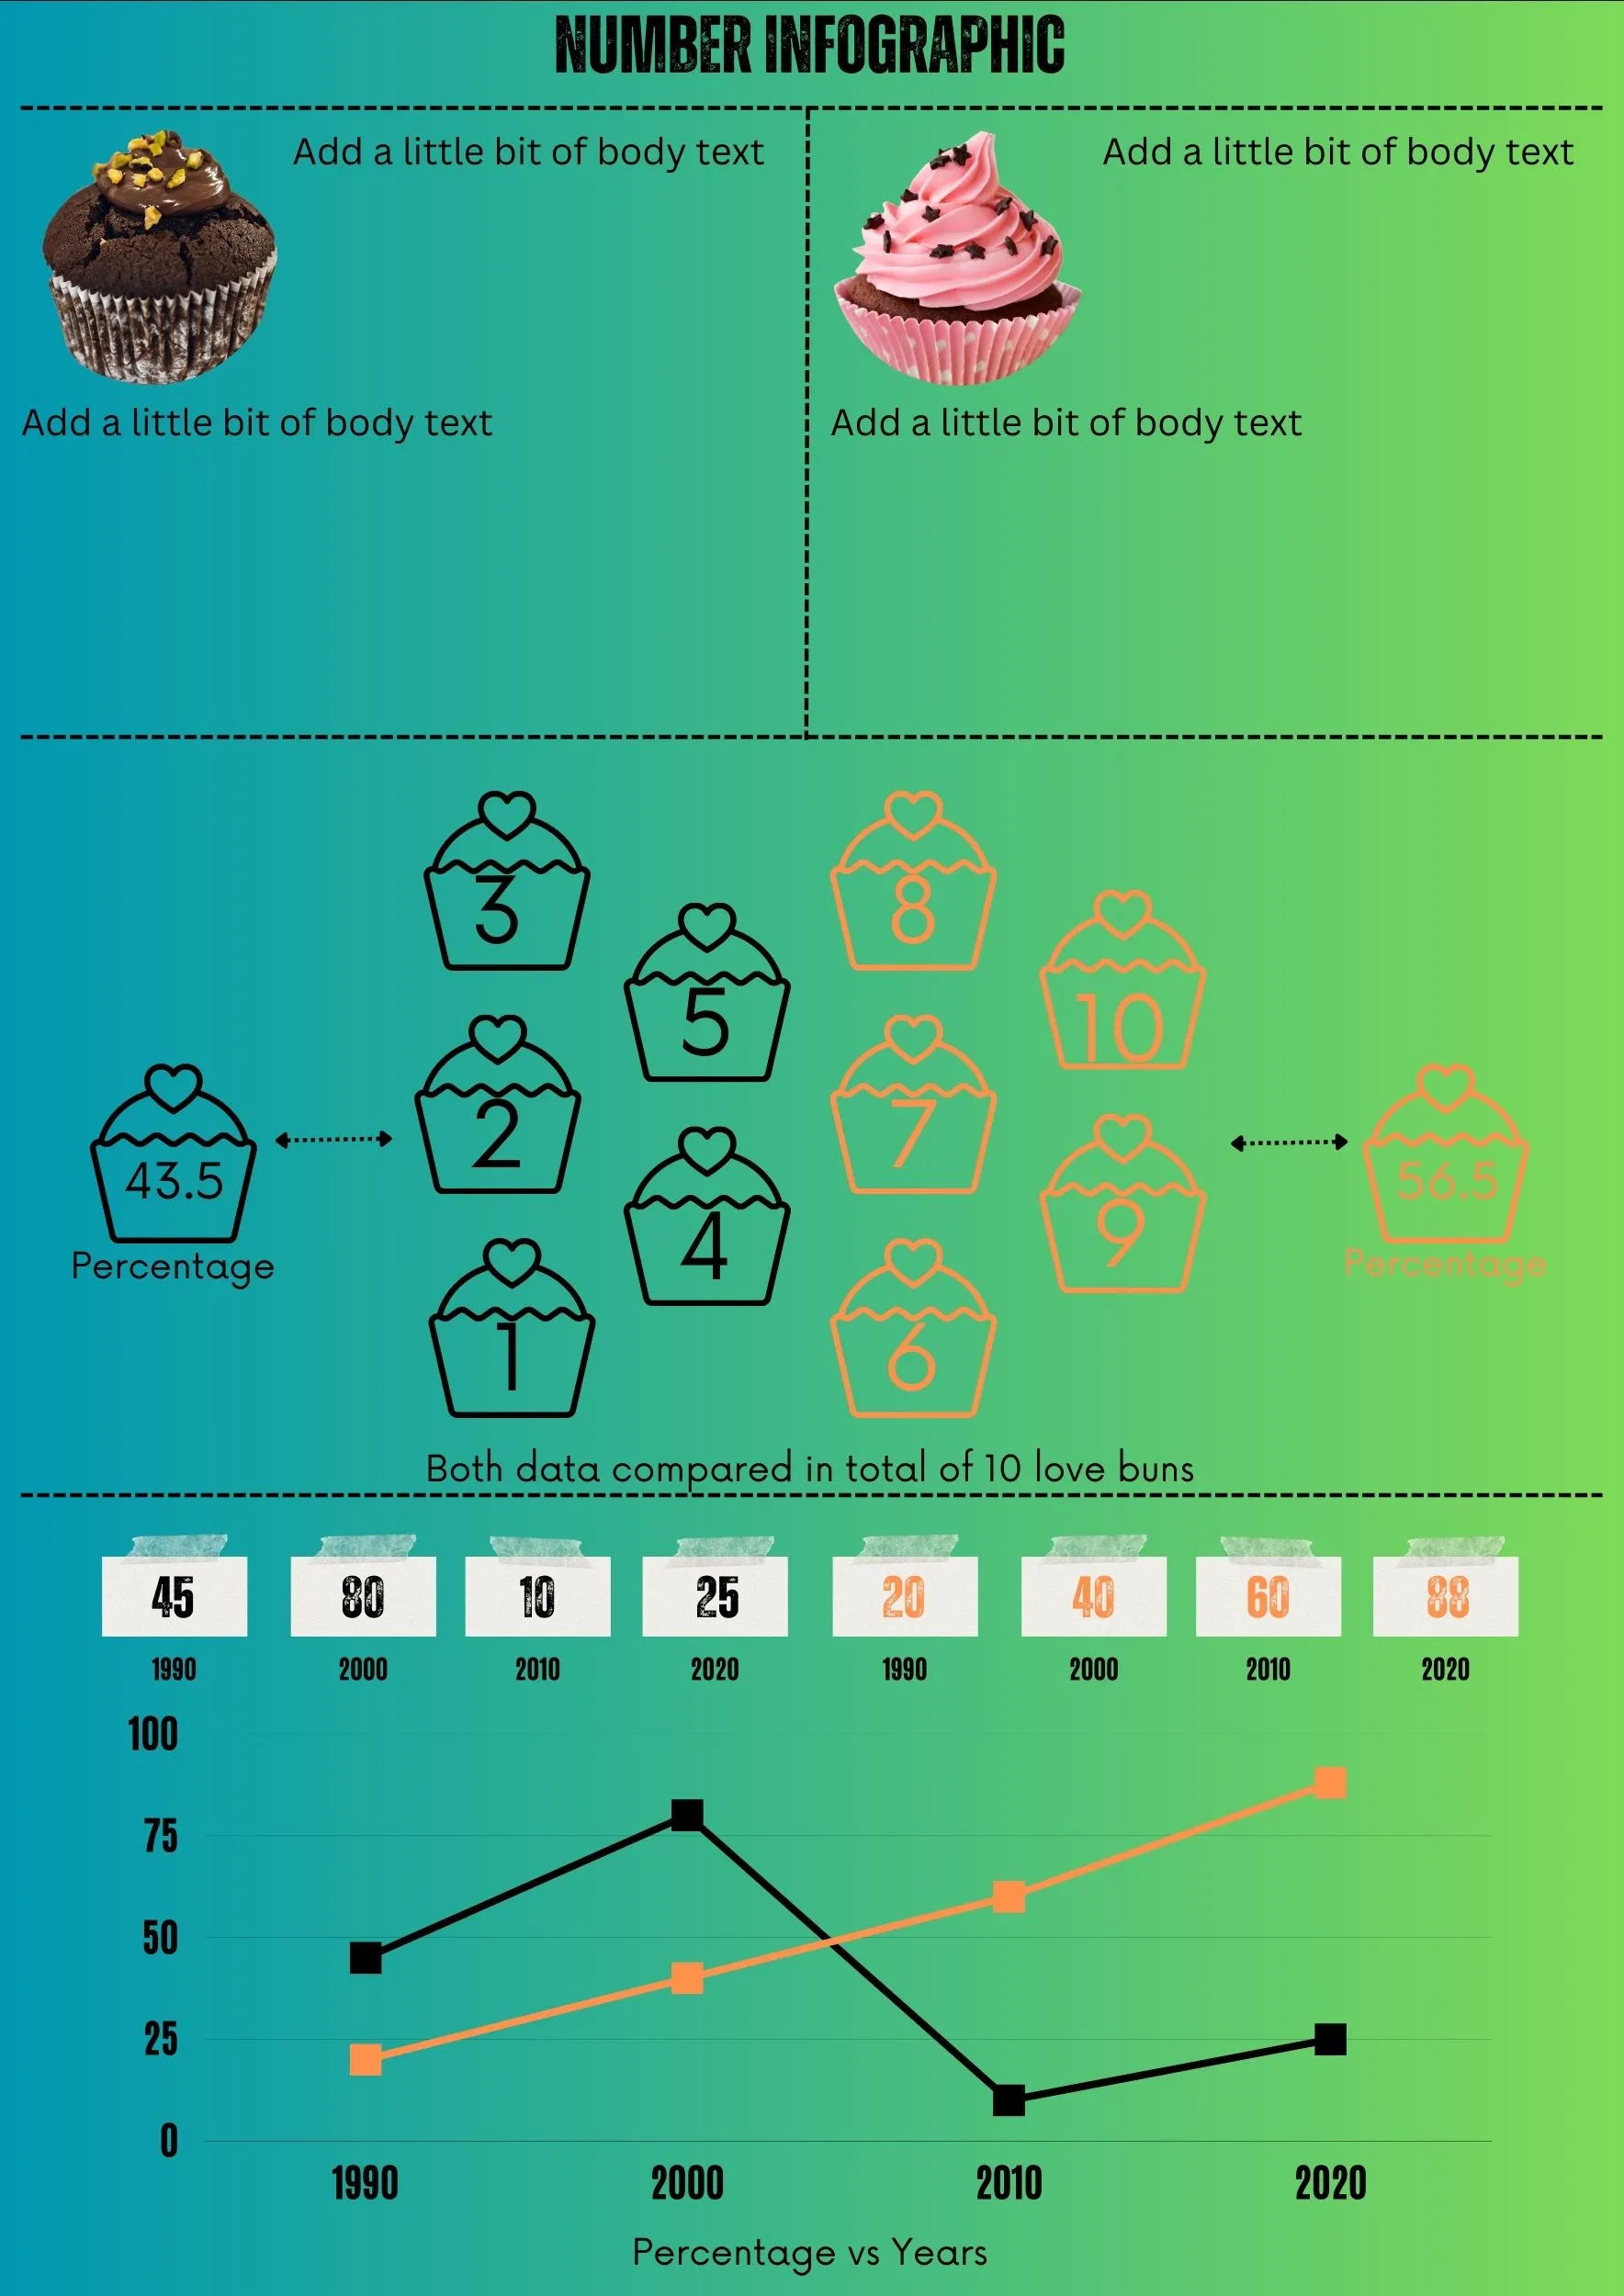
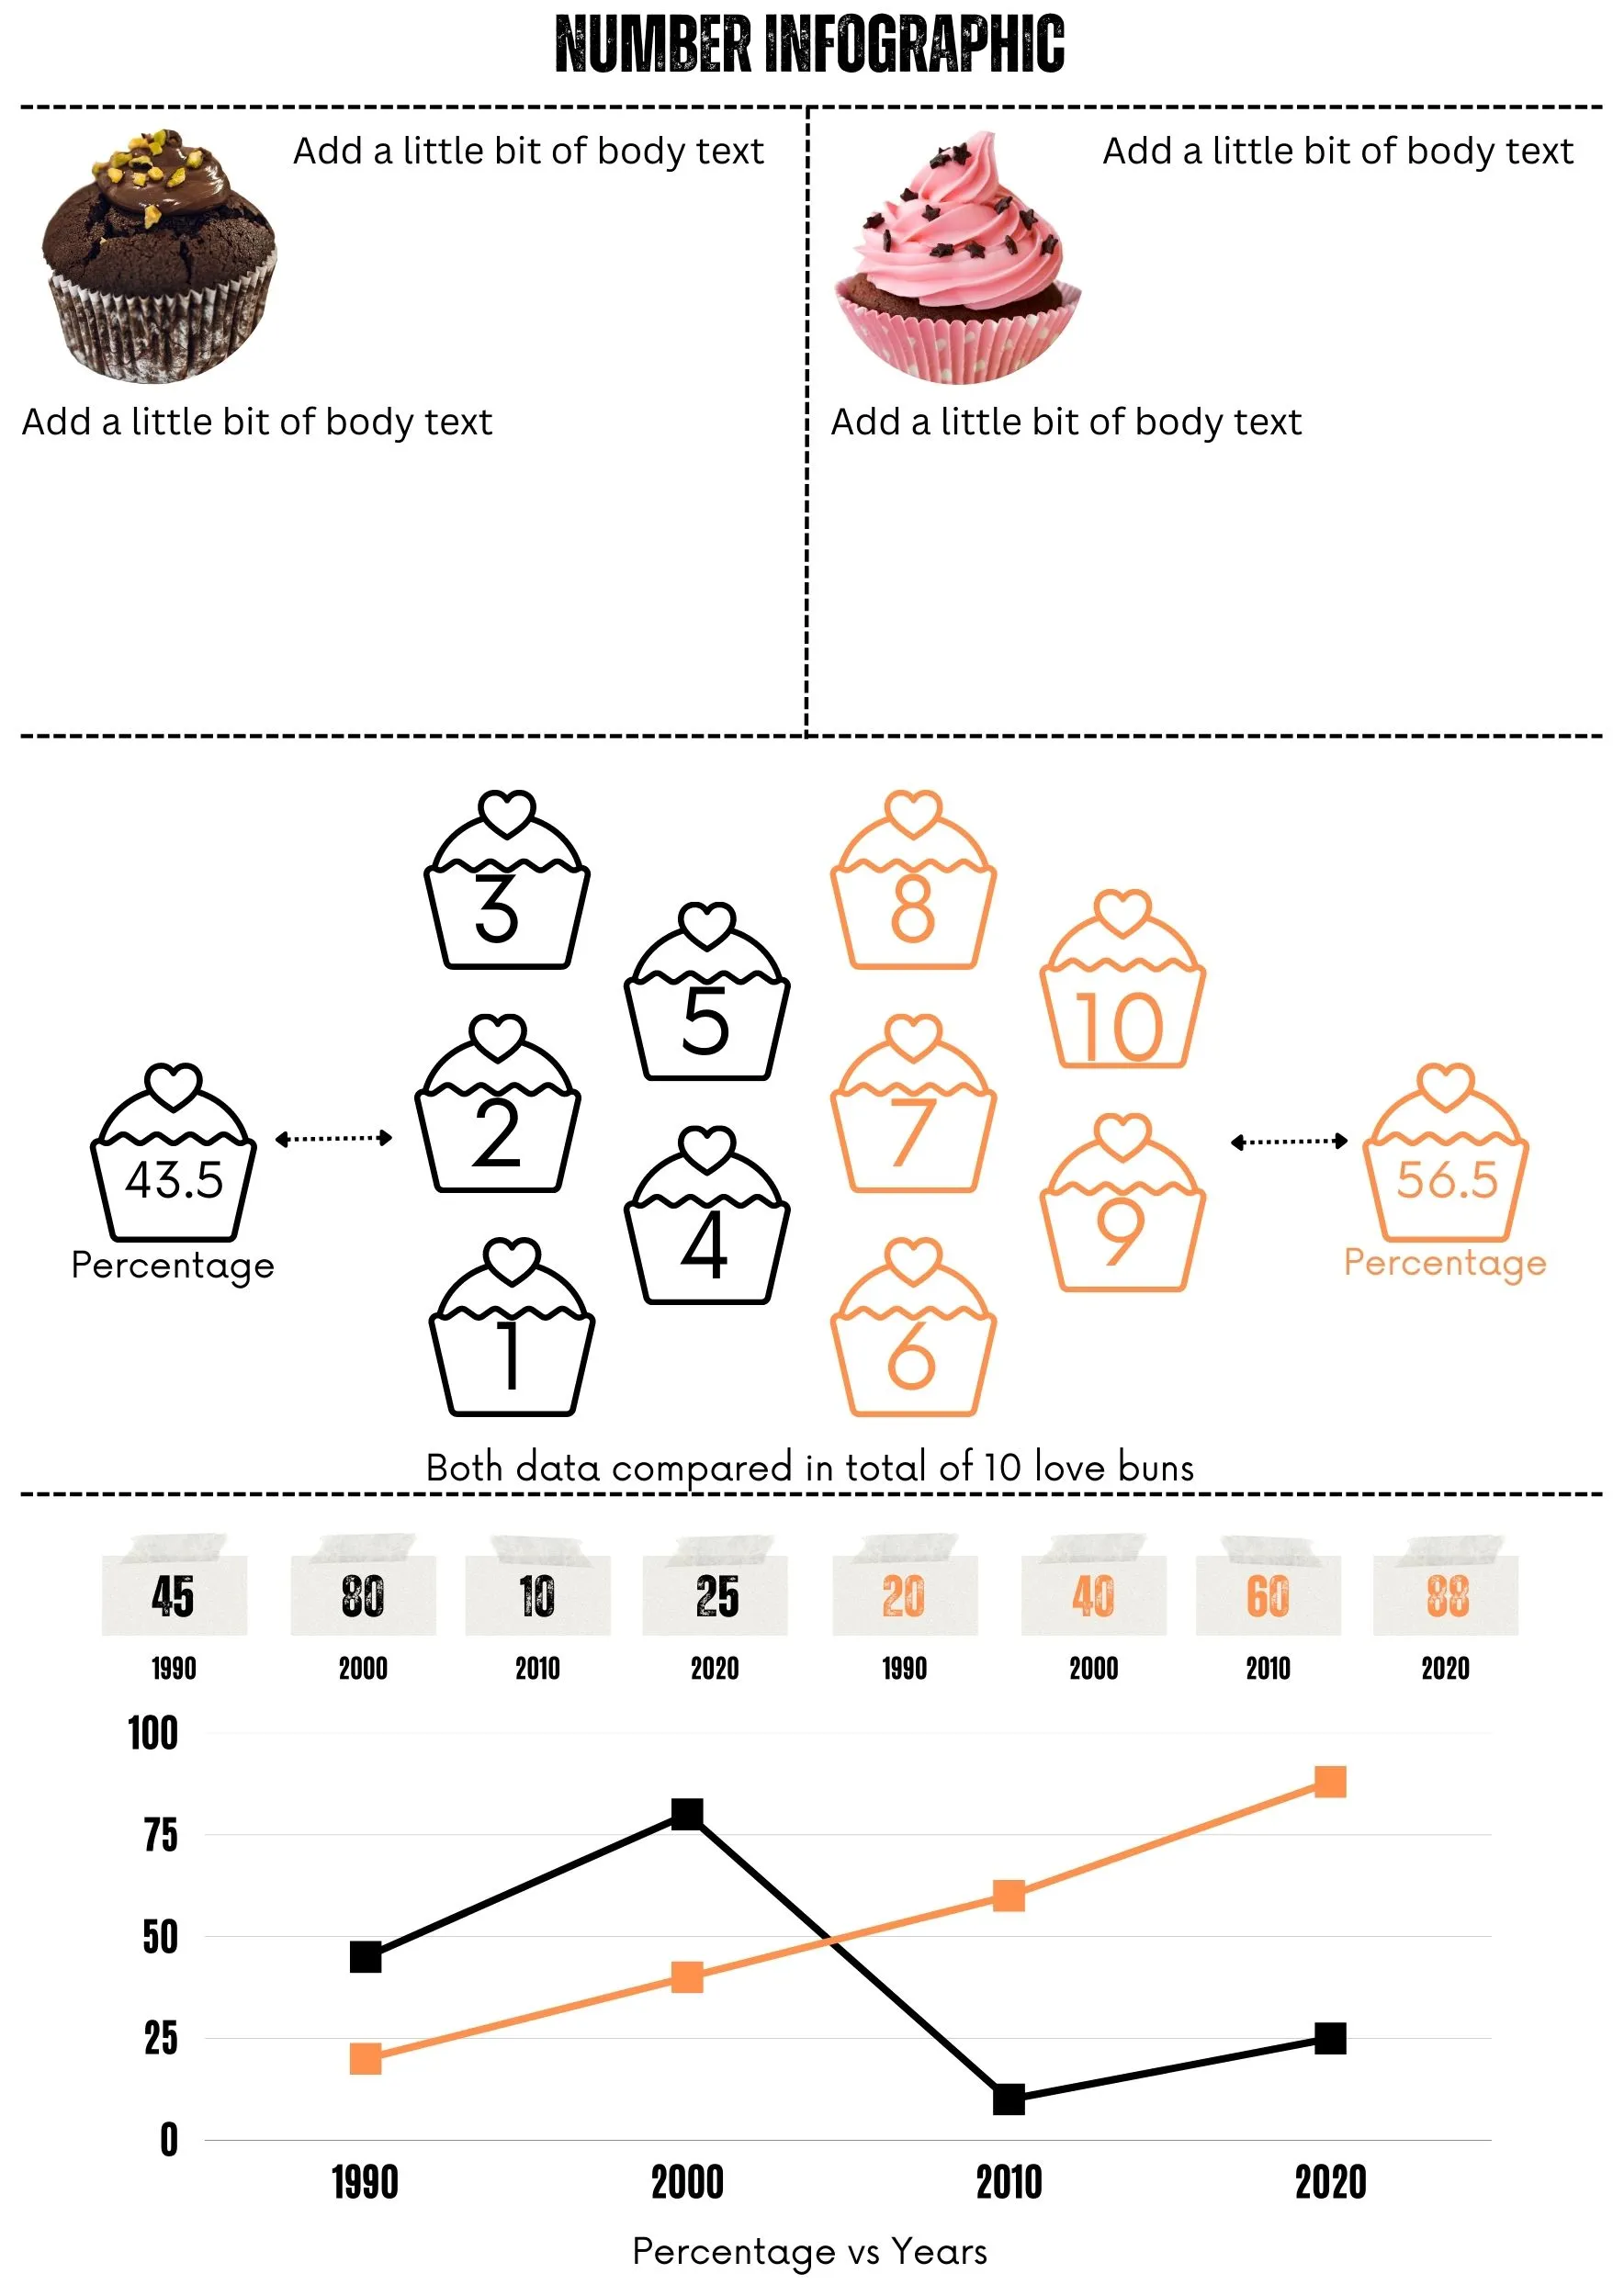
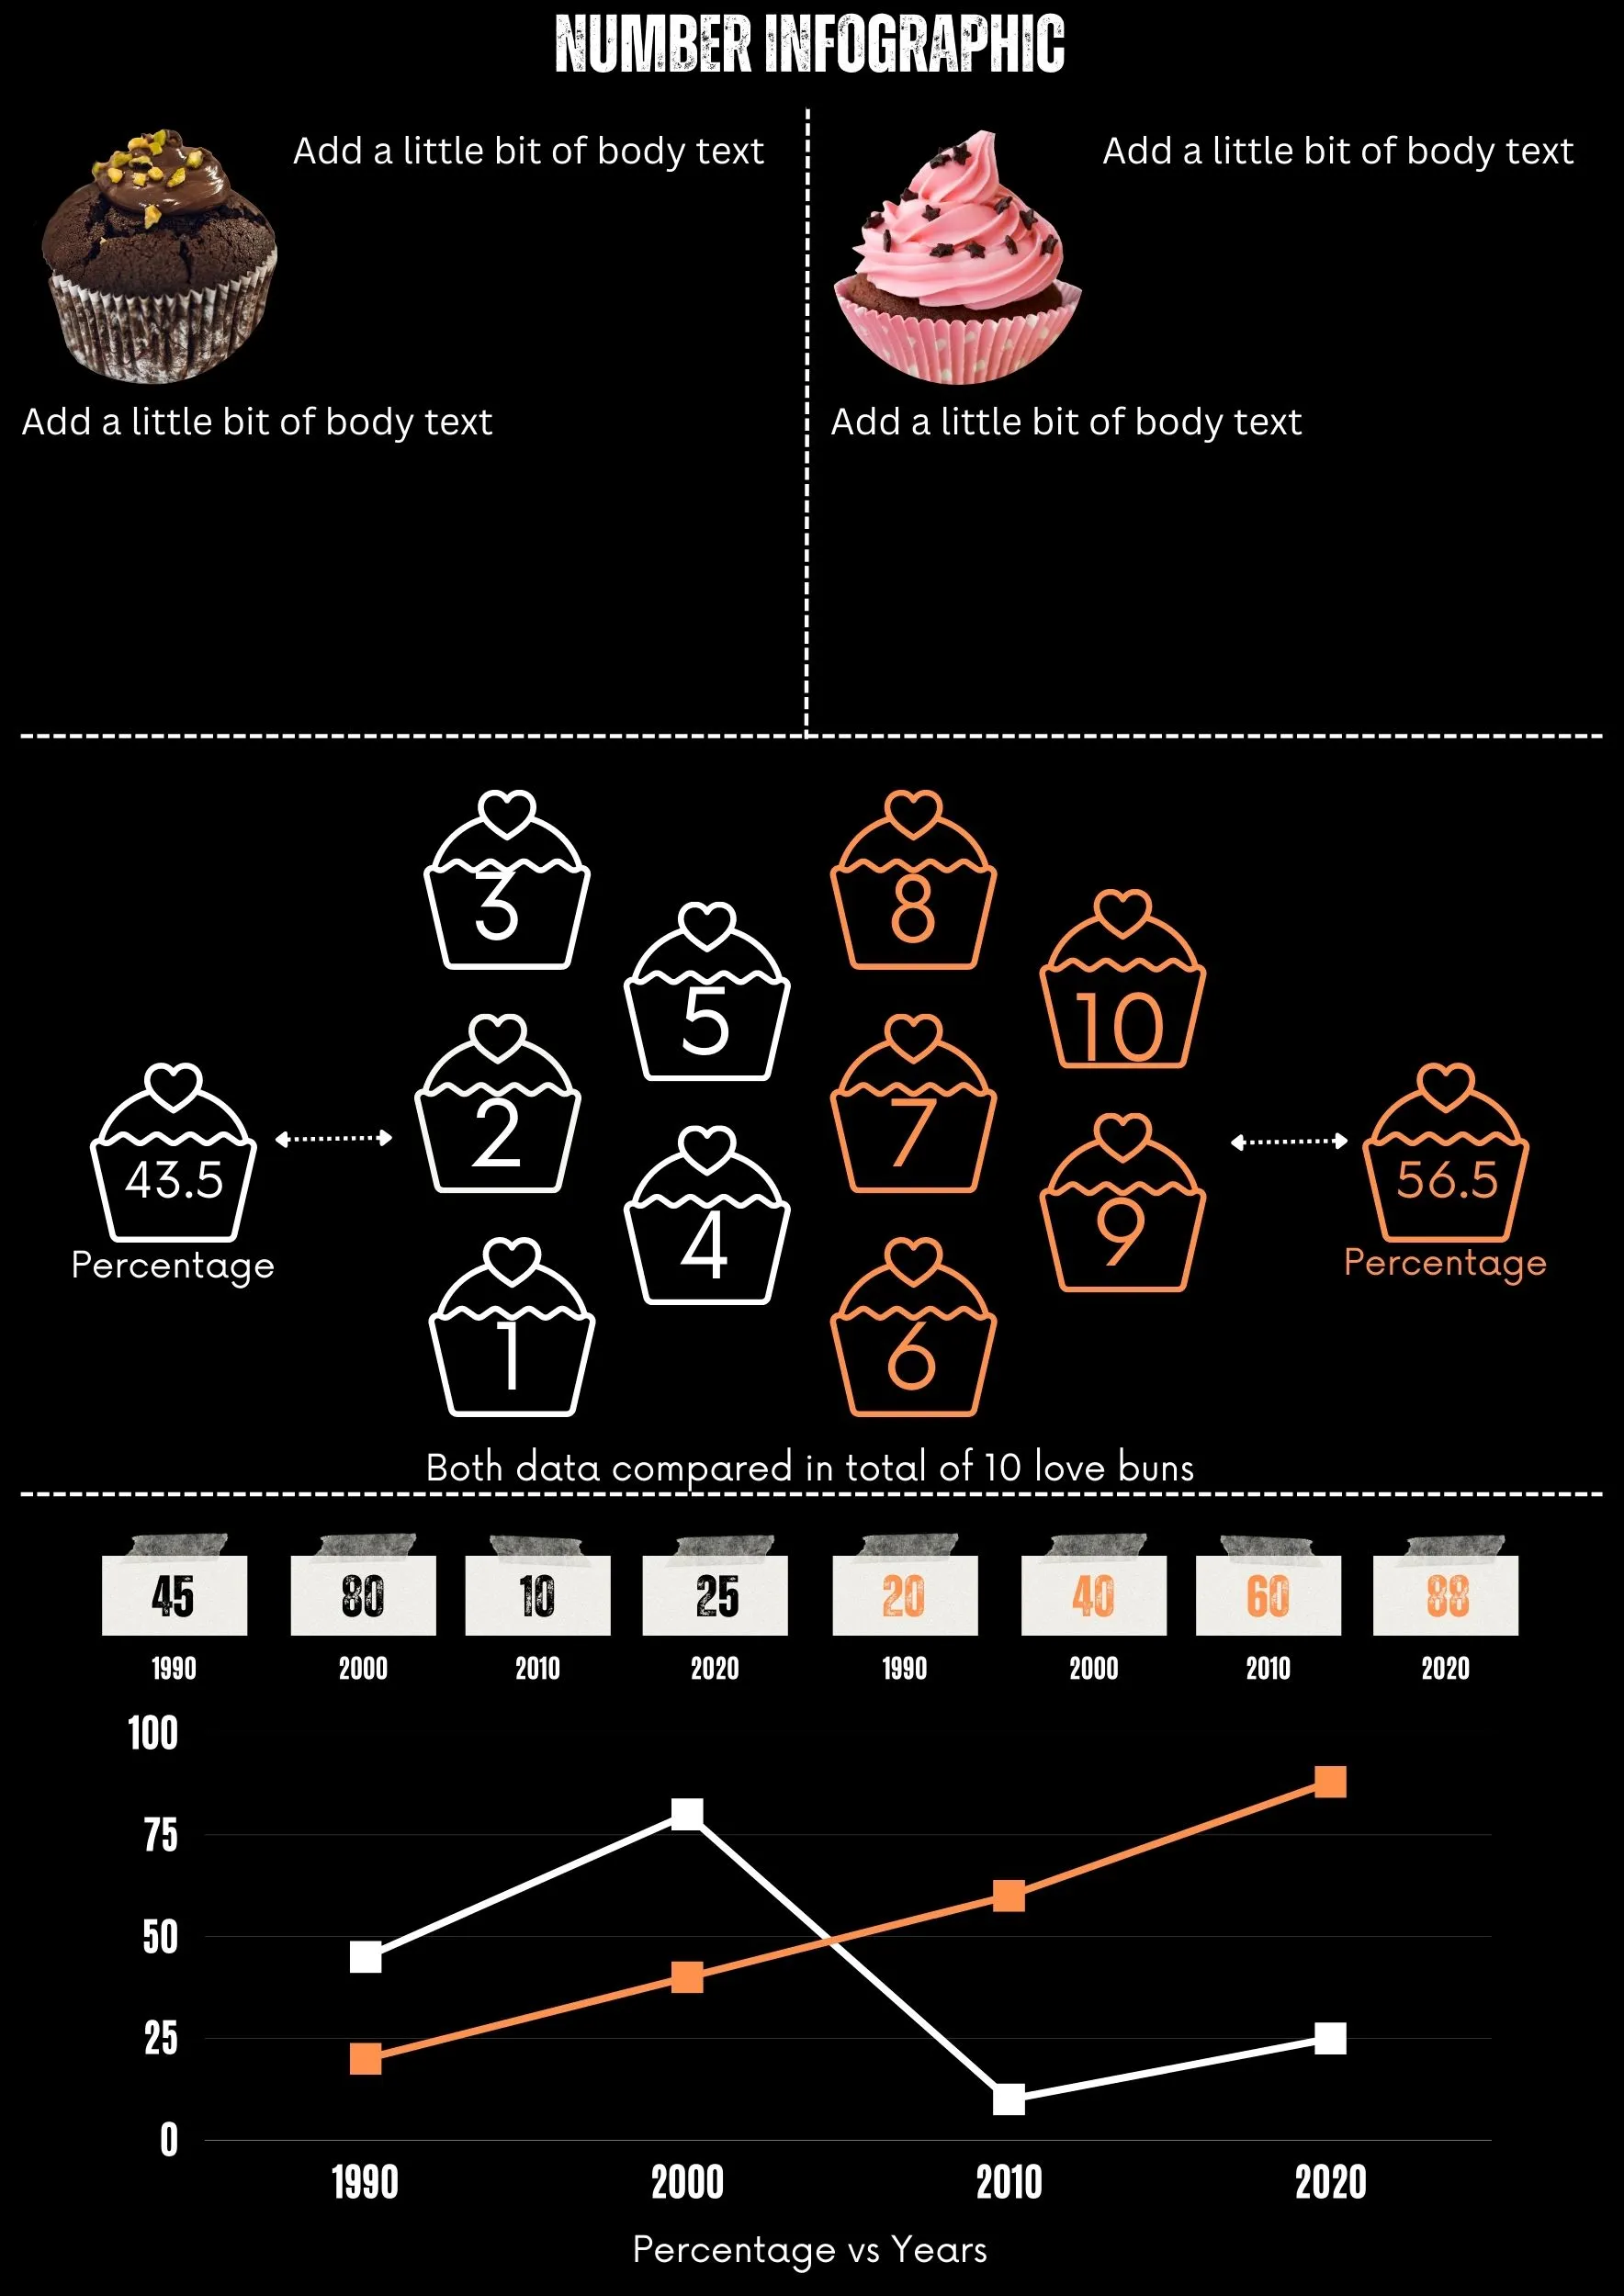
Numbers infographics are a specific type of infographic that focuses on data and statistics. They are often used to communicate complex information in a way that is easy to understand. Numbers infographics allow for easy comparison of data sets, and can be used to visually express results of studies or surveys. They are also effective in telling stories and in creating a visual representation of trends and relationships.
As a visual learner, I find that infographics are a great way to convey information in a clear and easy-to-understand way.
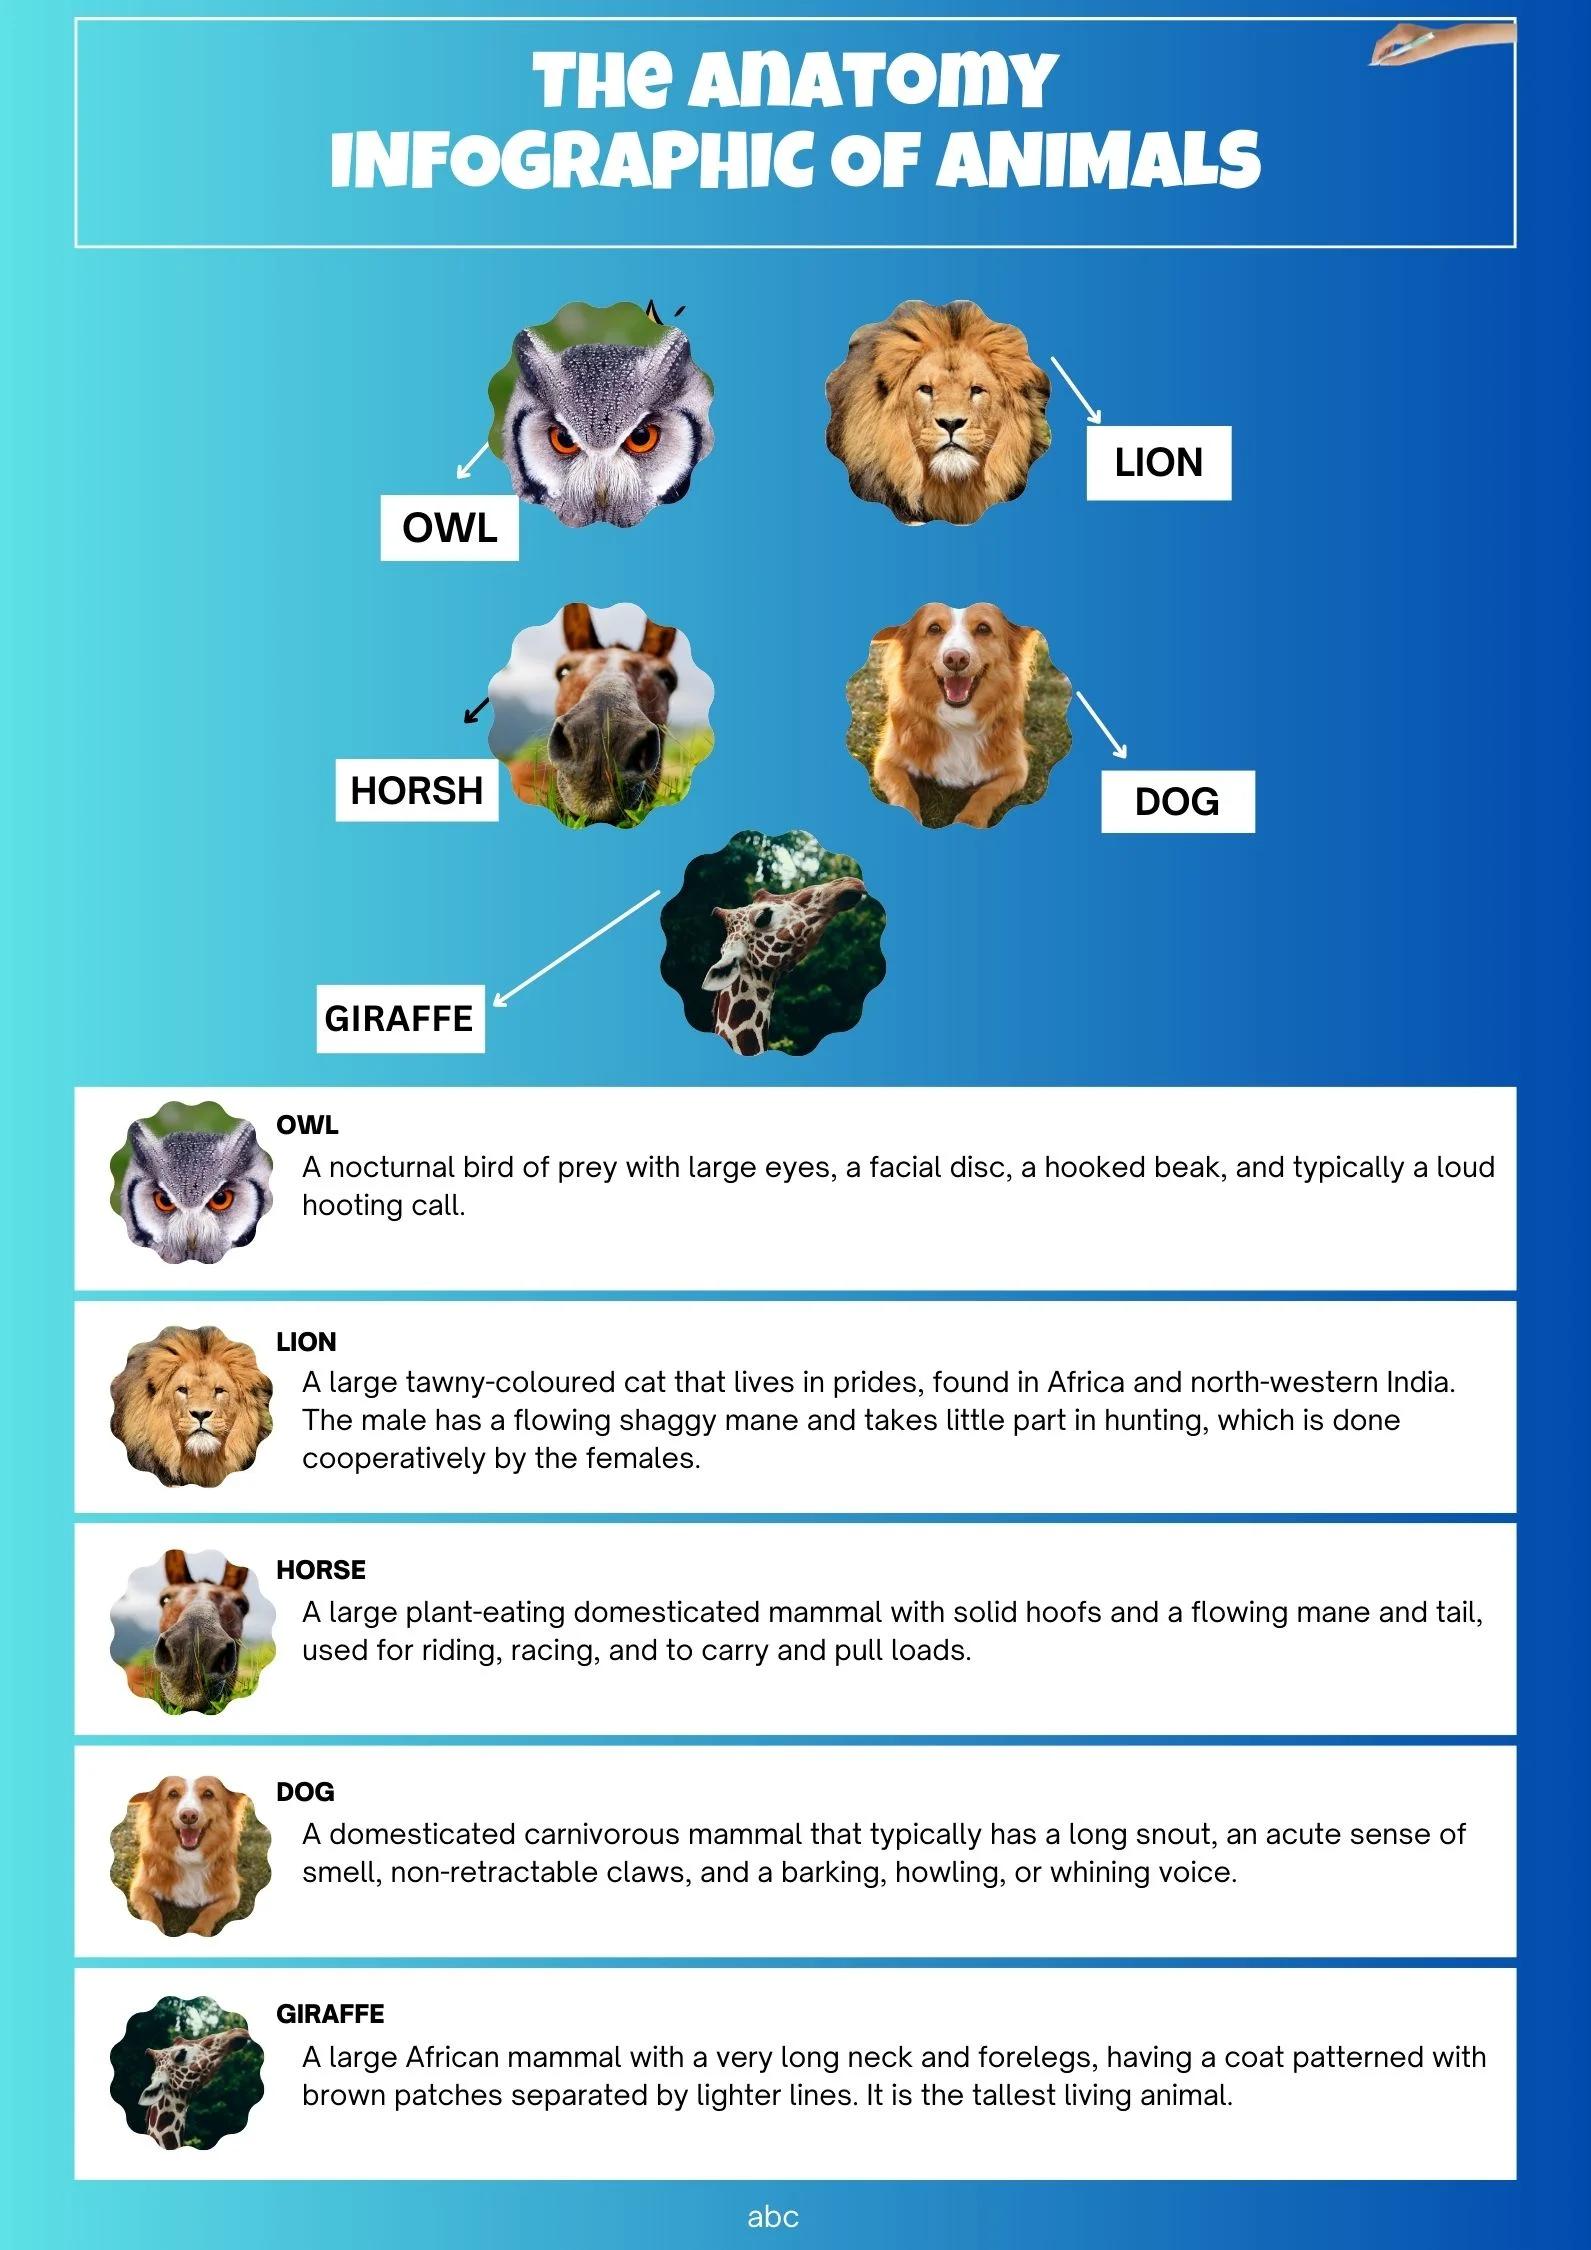
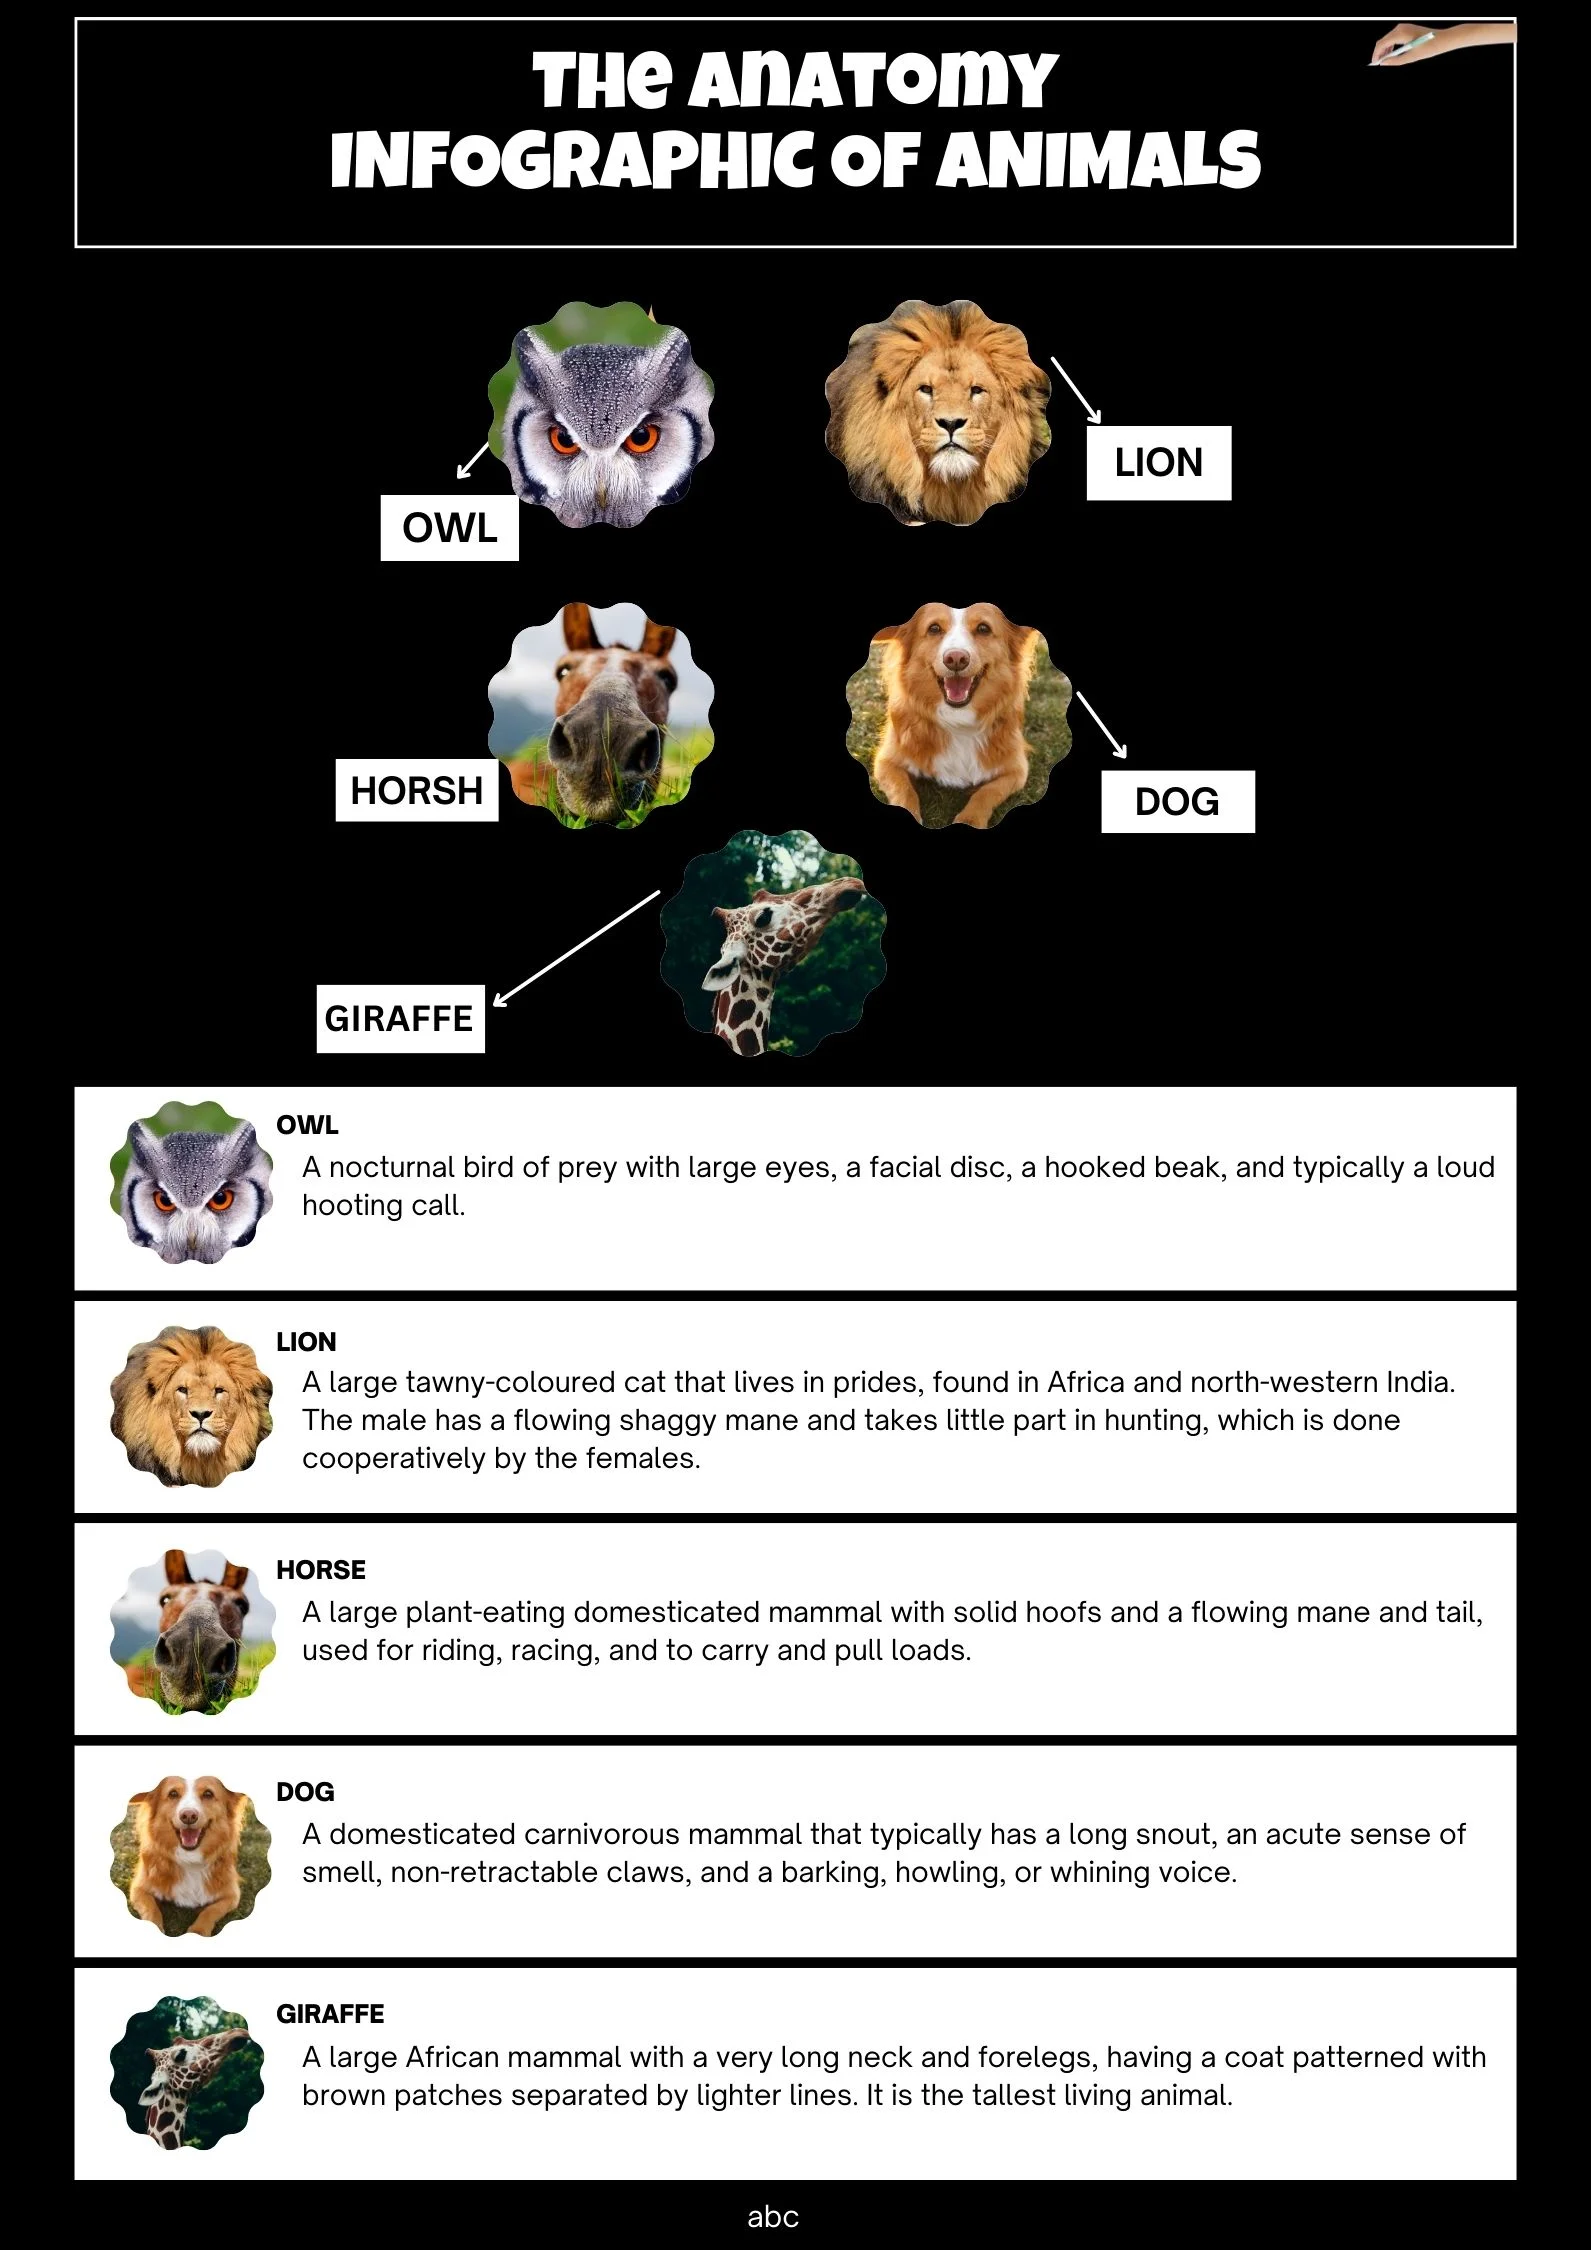
Anatomical infographics are visual representations of the human body that are designed to be easy to understand. They often use simple, colorful graphics to illustrate complex anatomical concepts. Anatomical infographics can be used by students, doctors, and anyone else who wants to learn more about the human body.
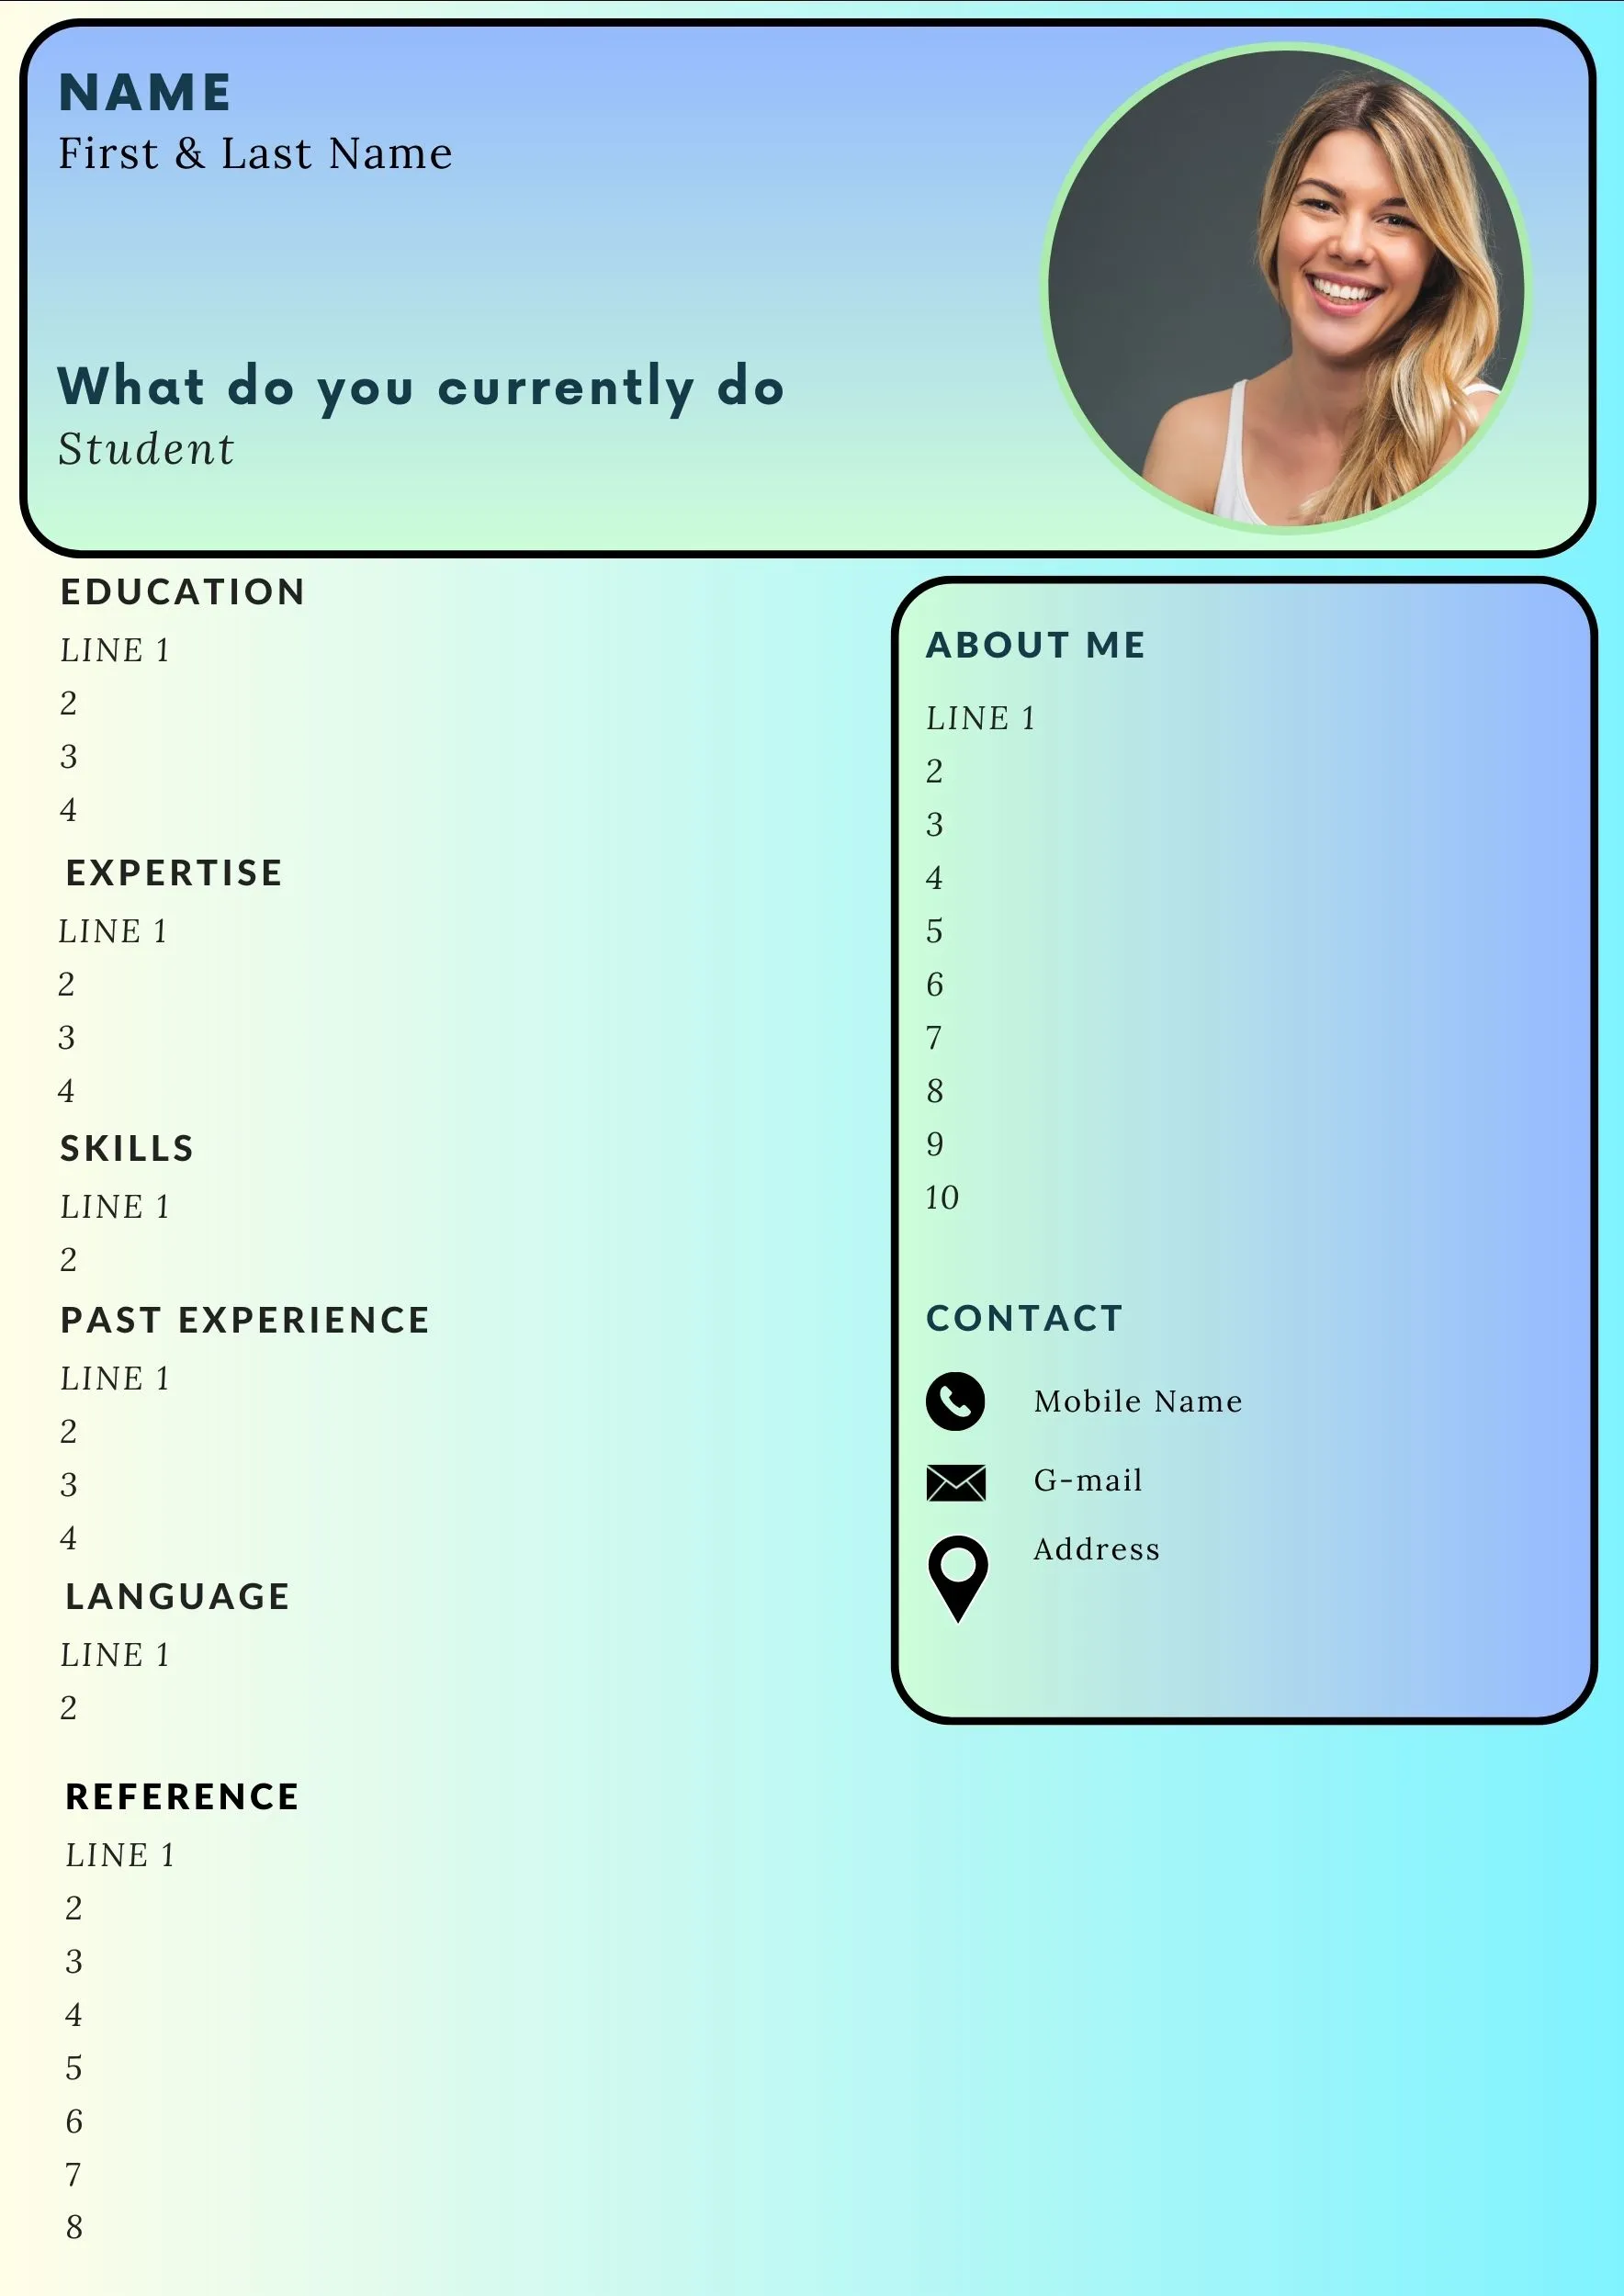
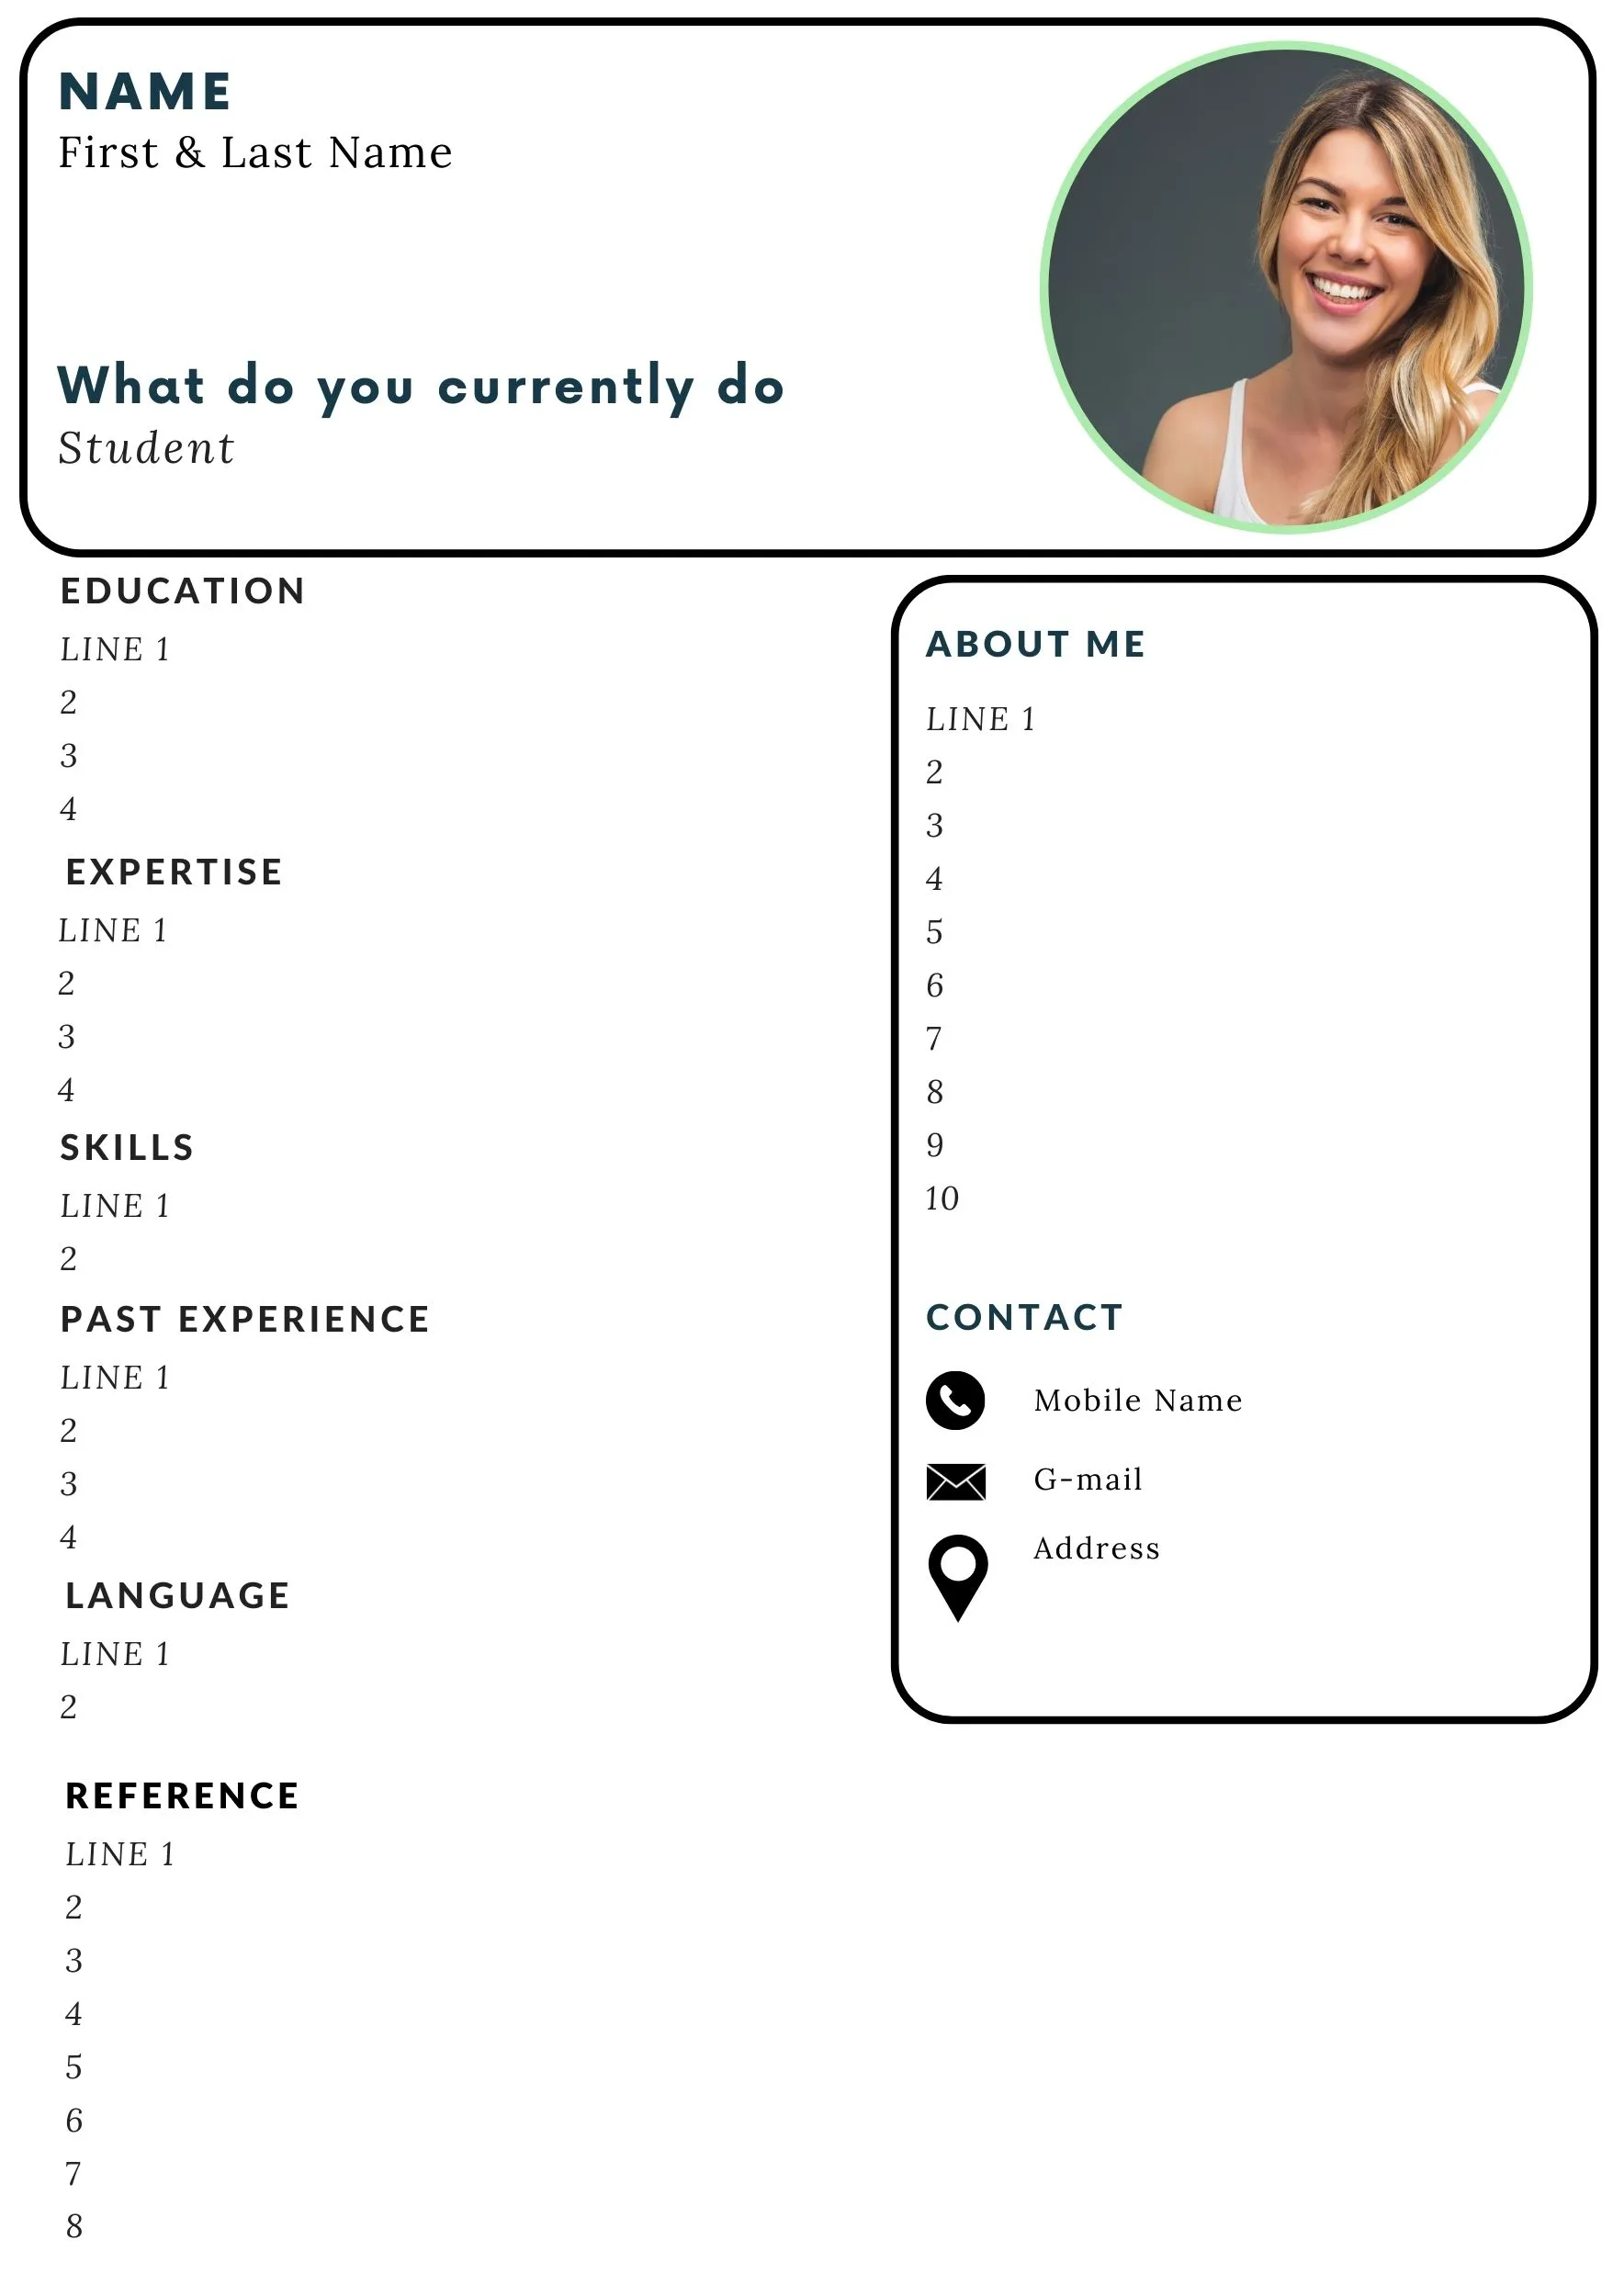
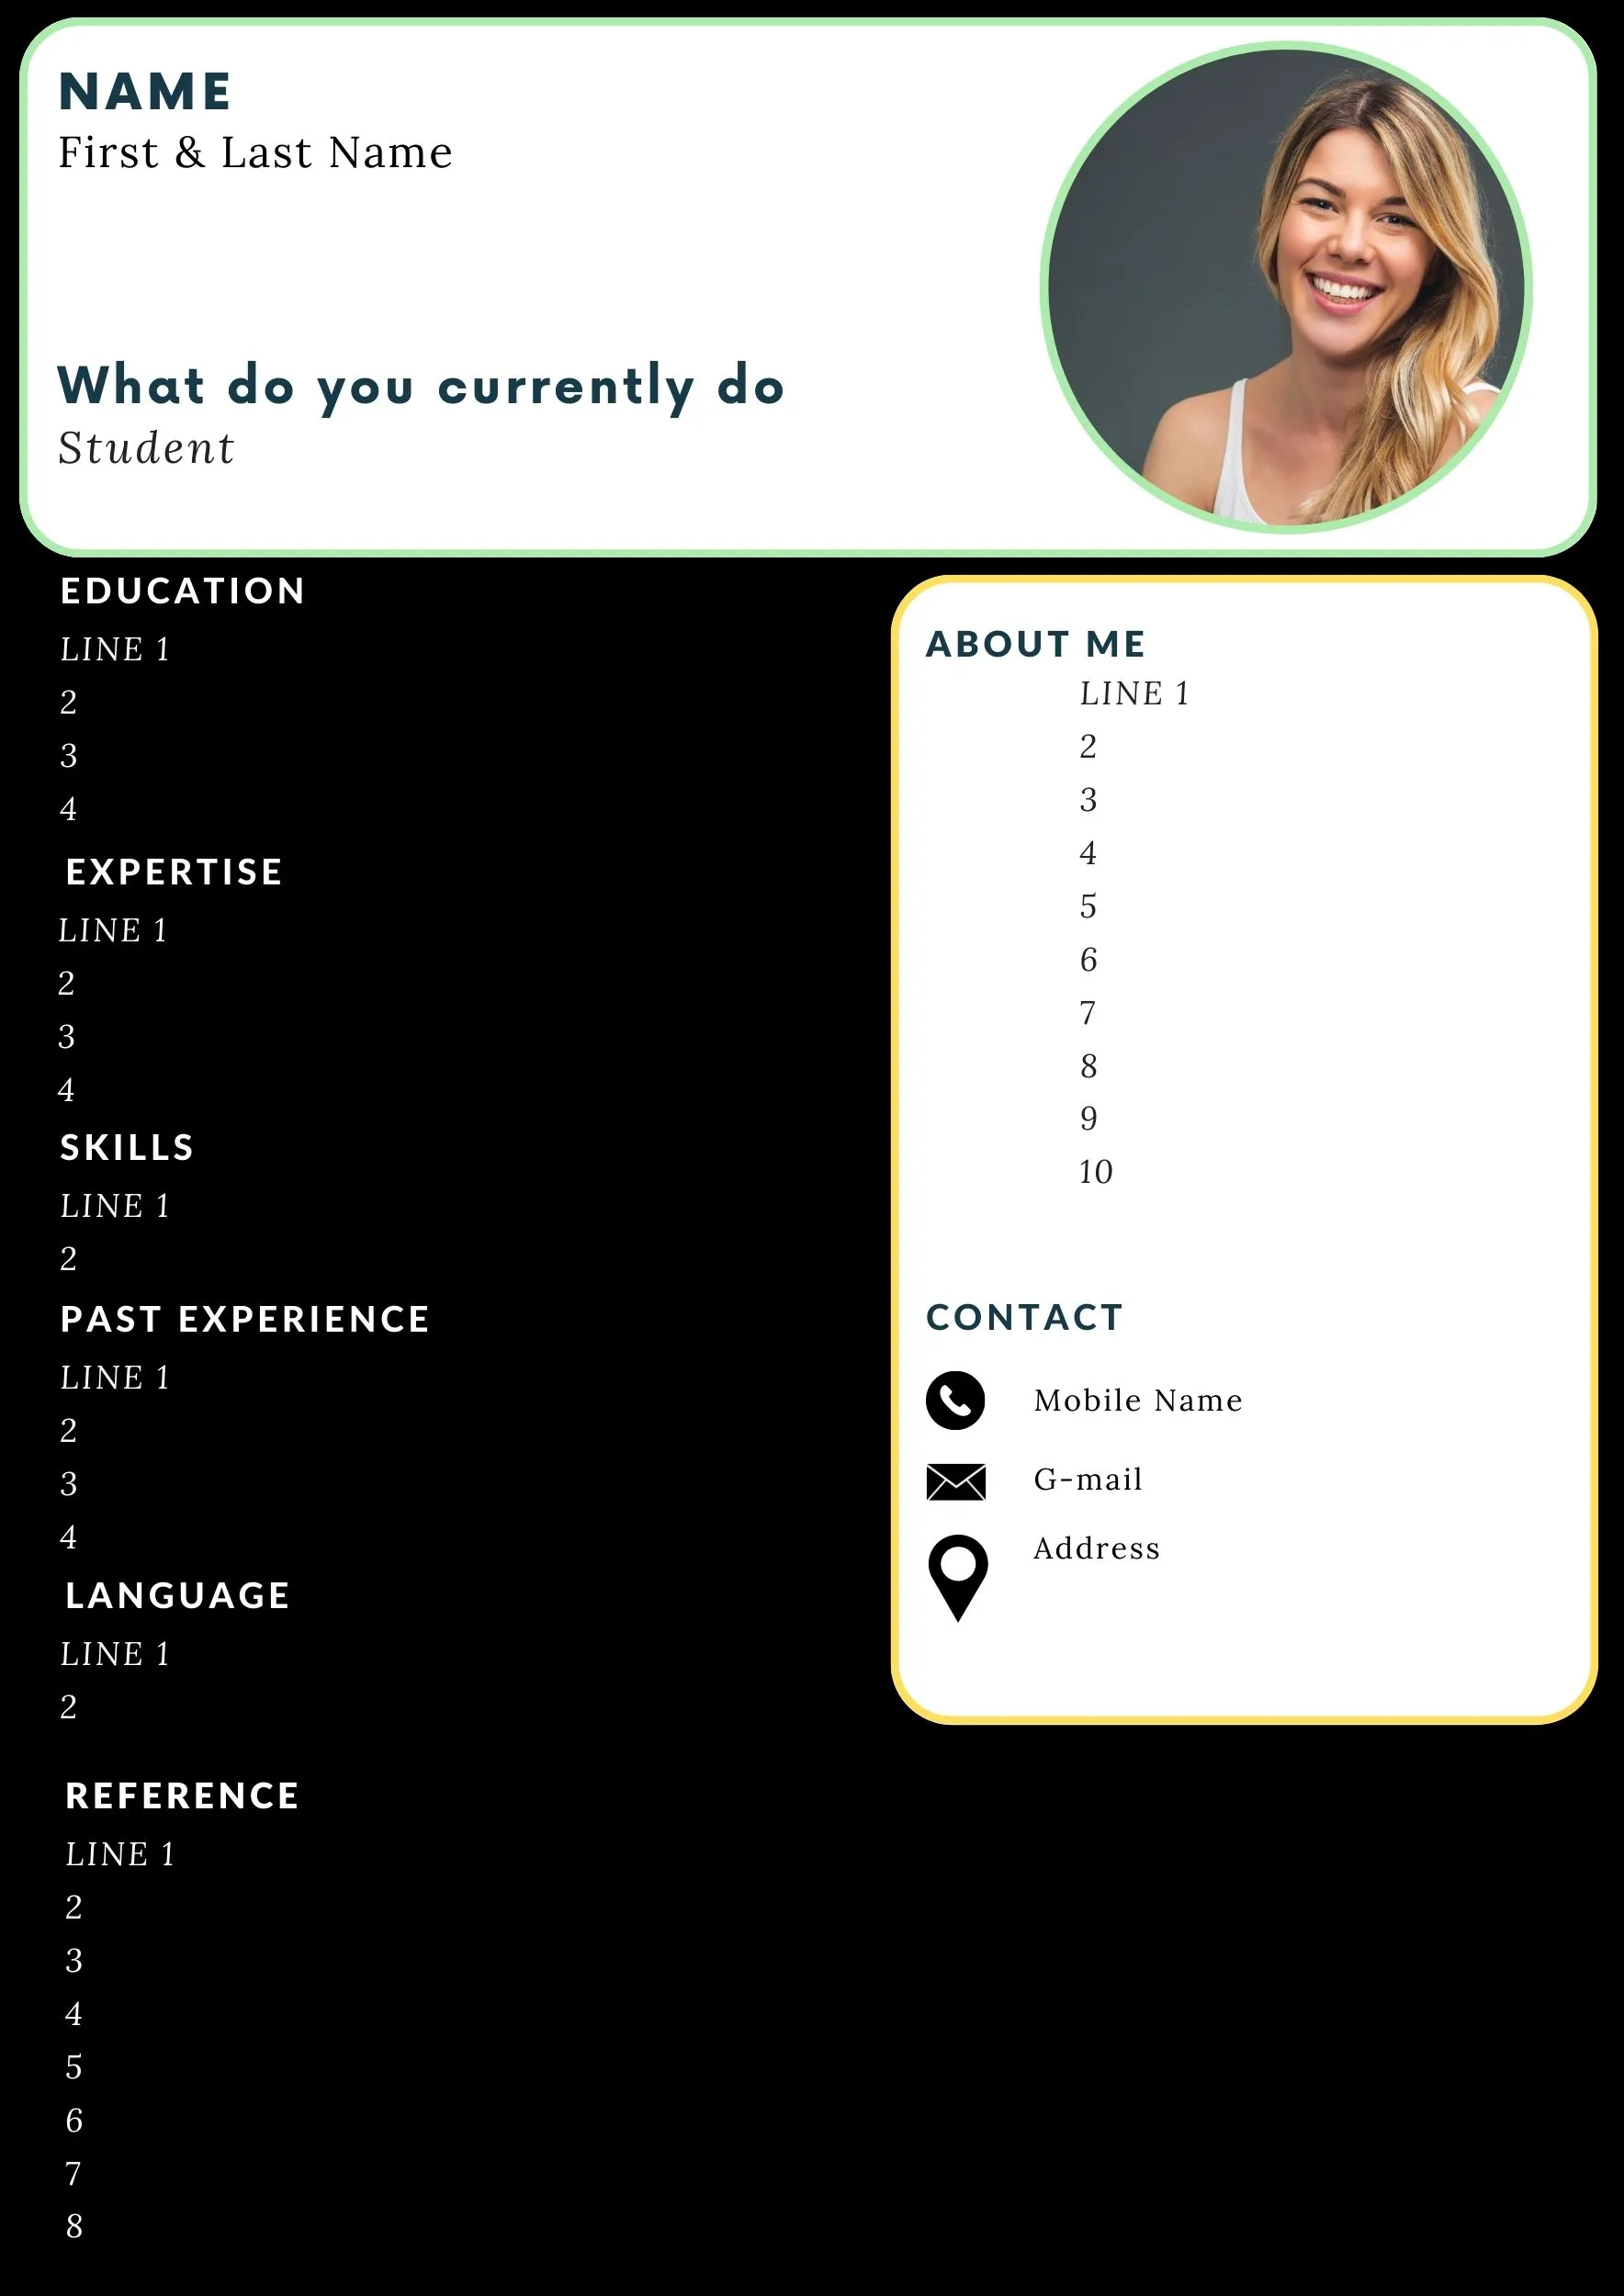
An infographic resume is a resume that uses visual elements, such as charts, graphs, and icons, to present your work experience, skills, and education. Infographic resumes can be a great way to stand out from the competition and make a strong first impression on potential employers.
Data infographics are a powerful tool for communicating information quickly and effectively. By taking complex data and turning it into a visually appealing graphic, data infographics can convey complex information in a way that is far easier to understand and remember.